EXHIBIT 99.2
Published on August 1, 2024
|
©2024 Concentra Inc. All rights reserved. 2nd Quarter 2024 Results August 1, 2024 |

|
©2024 Concentra Inc. All rights reserved. Forward-Looking Statements This presentation contains forward-looking statements that express the Company’s opinions, expectations, beliefs, plans, objectives, assumptions or projections regarding future events or future results that include, but are not limited to, financial guidance and other projections and forecasts. These forward-looking statements involve a number of risks, uncertainties (some of which are beyond the Company’s control) or other assumptions that may cause actual results or performance to be materially different from those expressed or implied by these forward-looking statements. These risks and uncertainties include, but are not limited to, those factors described in the Company’s filings with the Securities and Exchange Commission (“SEC”), including those under “Risk Factors” therein. Should one or more of these risks or uncertainties materialize, or should any of the assumptions prove incorrect, actual results may vary in material respects from those projected in these forward-looking statements. Forward-looking statements speak only as of the date made. The Company does not undertake any obligation to update or revise any forward-looking statements, whether as a result of new information, future events or otherwise, except as may be required under applicable securities laws. Use of Non-GAAP Financial Information In order to provide investors with greater insight, promote transparency and allow for a more comprehensive understanding of the information used by management in its financial and operational decision making, the Company supplements its condensed consolidated financial statements presented on a GAAP basis herein with certain non-GAAP financial information, including reconciliations of these non-GAAP measures to their most directly comparable GAAP measures, which are included in this presentation, as well as in the Company’s quarterly financial press releases and related Form 8-K filings with the SEC. This information can be accessed for free by visiting www.concentra.com or www.sec.gov. We believe that the presentation of Adjusted EBITDA and Adjusted EBITDA margin, as defined herein, are important to investors because Adjusted EBITDA and Adjusted EBITDA margin are commonly used as an analytical indicator of performance by investors within the healthcare industry. Adjusted EBITDA and Adjusted EBITDA margin are used by management to evaluate financial performance of, and determine resource allocation for, each of our operating segments. However, Adjusted EBITDA and Adjusted EBITDA margin are not measures of financial performance under U.S. GAAP. Items excluded from Adjusted EBITDA and Adjusted EBITDA margin are significant components in understanding and assessing financial performance. Adjusted EBITDA and Adjusted EBITDA margin should not be considered in isolation, or as an alternative to, or substitute for, net income, net income margin, income from operations, cash flows generated by operations, investing or financing activities, or other financial statement data presented in the consolidated financial statements as indicators of financial performance or liquidity. Because Adjusted EBITDA and Adjusted EBITDA margin are not measurements determined in accordance with U.S. GAAP and are thus susceptible to varying definitions, Adjusted EBITDA and Adjusted EBITDA margin as presented may not be comparable to other similarly titled measures of other companies. We define Adjusted EBITDA as earnings excluding interest, income taxes, depreciation and amortization, gain (loss) on early retirement of debt, stock compensation expense, separation transaction costs, gain (loss) on sale of businesses, and equity in earnings (losses) of unconsolidated subsidiaries. We define Adjusted EBITDA margin as Adjusted EBITDA divided by revenue. We will refer to Adjusted EBITDA and Adjusted EBITDA margin throughout these materials. Management has not reconciled forward-looking non-GAAP measures to its most directly comparable GAAP measure of Gross Profit, Operating Income, Net Income, and Net cash provided by operating activities. This is because the Company cannot predict with reasonable certainty and without unreasonable efforts the ultimate outcome of certain GAAP components of such reconciliations due to market related assumptions that are not within our control as well as certain legal or advisory costs, tax costs or other costs that may arise. For these reasons, management is unable to assess the probable significance of the unavailable information, which could materially impact the amount of the future directly comparable GAAP measures. Disclaimer 2 |
|
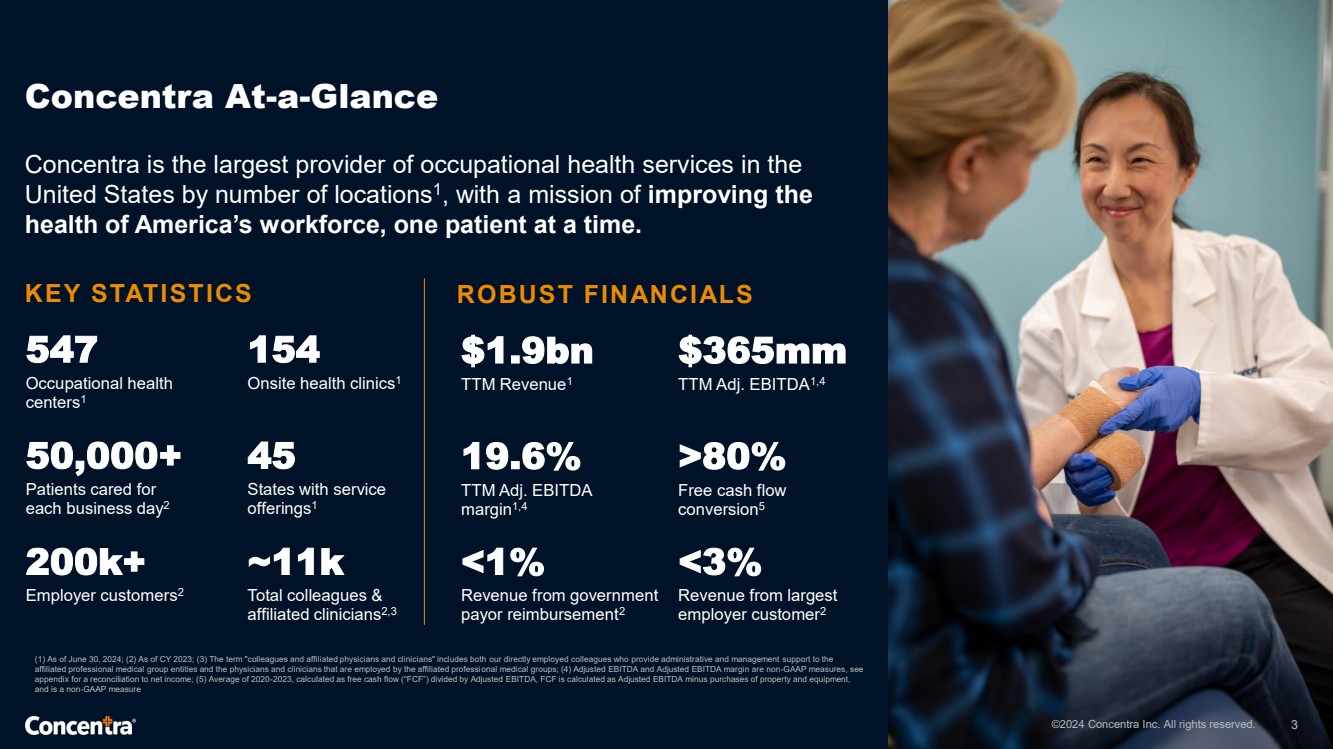
©2024 Concentra Inc. All rights reserved. Concentra At-a-Glance 3 Concentra is the largest provider of occupational health services in the United States by number of locations1 , with a mission of improving the health of America’s workforce, one patient at a time. KEY STATISTICS 154 Onsite health clinics1 ~11k Total colleagues & affiliated clinicians2,3 $1.9bn TTM Revenue1 19.6% TTM Adj. EBITDA margin1,4 45 States with service offerings1 200k+ Employer customers2 50,000+ Patients cared for each business day2 ROBUST FINANCIALS $365mm TTM Adj. EBITDA1,4 <1% Revenue from government payor reimbursement2 >80% Free cash flow conversion5 ©2024 Concentra Inc. All rights reserved. (1) As of June 30, 2024; (2) As of CY 2023; (3) The term "colleagues and affiliated physicians and clinicians" includes both our directly employed colleagues who provide administrative and management support to the affiliated professional medical group entities and the physicians and clinicians that are employed by the affiliated professional medical groups; (4) Adjusted EBITDA and Adjusted EBITDA margin are non-GAAP measures, see appendix for a reconciliation to net income; (5) Average of 2020-2023, calculated as free cash flow (“FCF”) divided by Adjusted EBITDA, FCF is calculated as Adjusted EBITDA minus purchases of property and equipment, and is a non-GAAP measure 547 Occupational health centers1 <3% Revenue from largest employer customer2 |
|
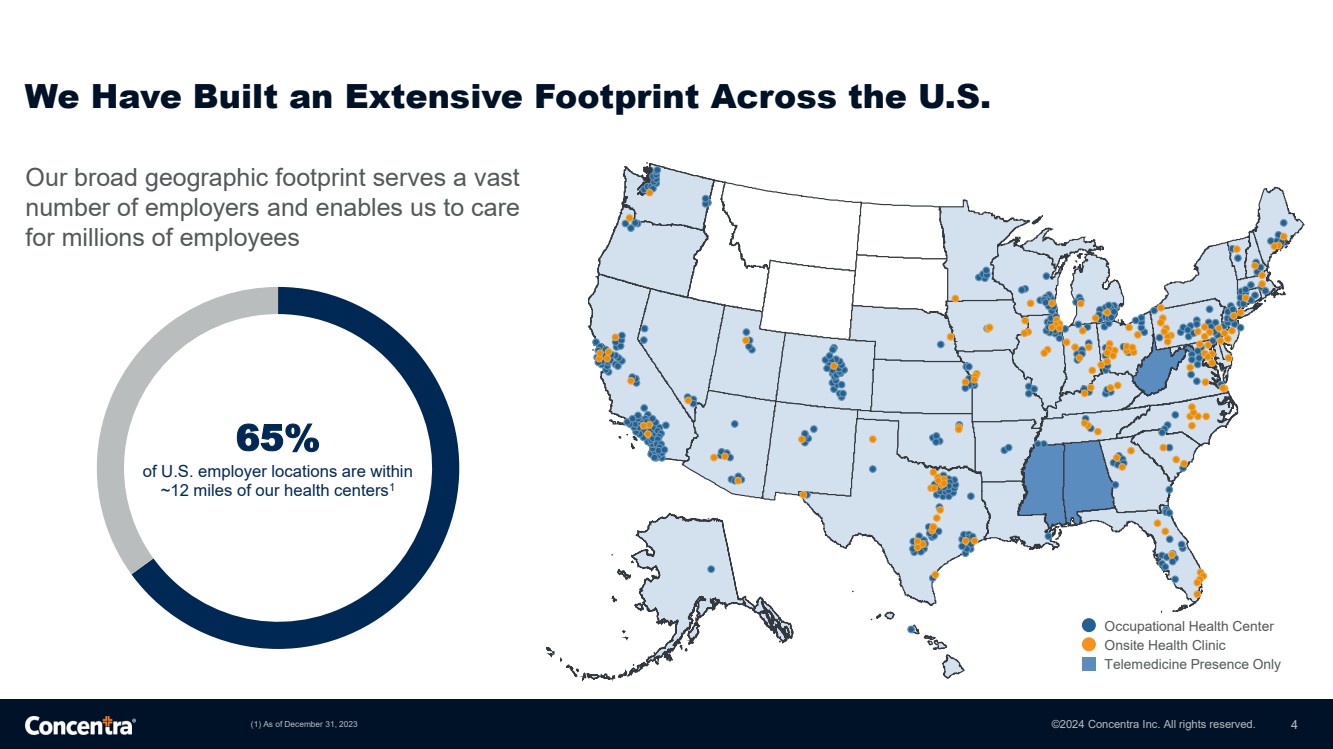
©2024 Concentra Inc. All rights reserved. We Have Built an Extensive Footprint Across the U.S. (1) As of December 31, 2023 4 Our broad geographic footprint serves a vast number of employers and enables us to care for millions of employees 65% of U.S. employer locations are within ~12 miles of our health centers1 Occupational Health Center Onsite Health Clinic Telemedicine Presence Only |
|
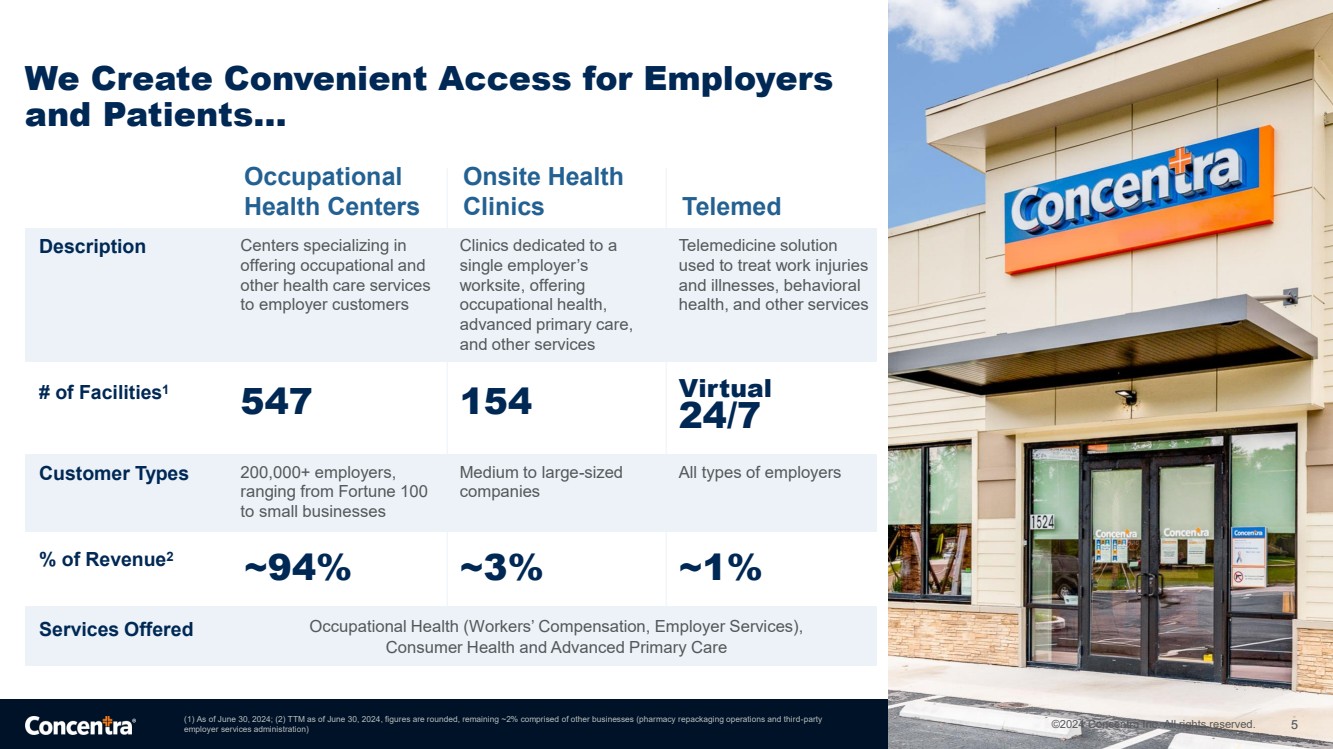
©2024 Concentra Inc. All rights reserved. We Create Convenient Access for Employers and Patients… 5 (1) As of June 30, 2024; (2) TTM as of June 30, 2024, figures are rounded, remaining ~2% comprised of other businesses (pharmacy repackaging operations and third-party employer services administration) Occupational Health Centers Onsite Health Clinics Telemed Description Centers specializing in offering occupational and other health care services to employer customers Clinics dedicated to a single employer’s worksite, offering occupational health, advanced primary care, and other services Telemedicine solution used to treat work injuries and illnesses, behavioral health, and other services # of Facilities1 547 154 Virtual 24/7 Customer Types 200,000+ employers, ranging from Fortune 100 to small businesses Medium to large-sized companies All types of employers % of Revenue2 ~94% ~3% ~1% Services Offered Occupational Health (Workers’ Compensation, Employer Services), Consumer Health and Advanced Primary Care ©2024 Concentra Inc. All rights reserved. 5 |
|
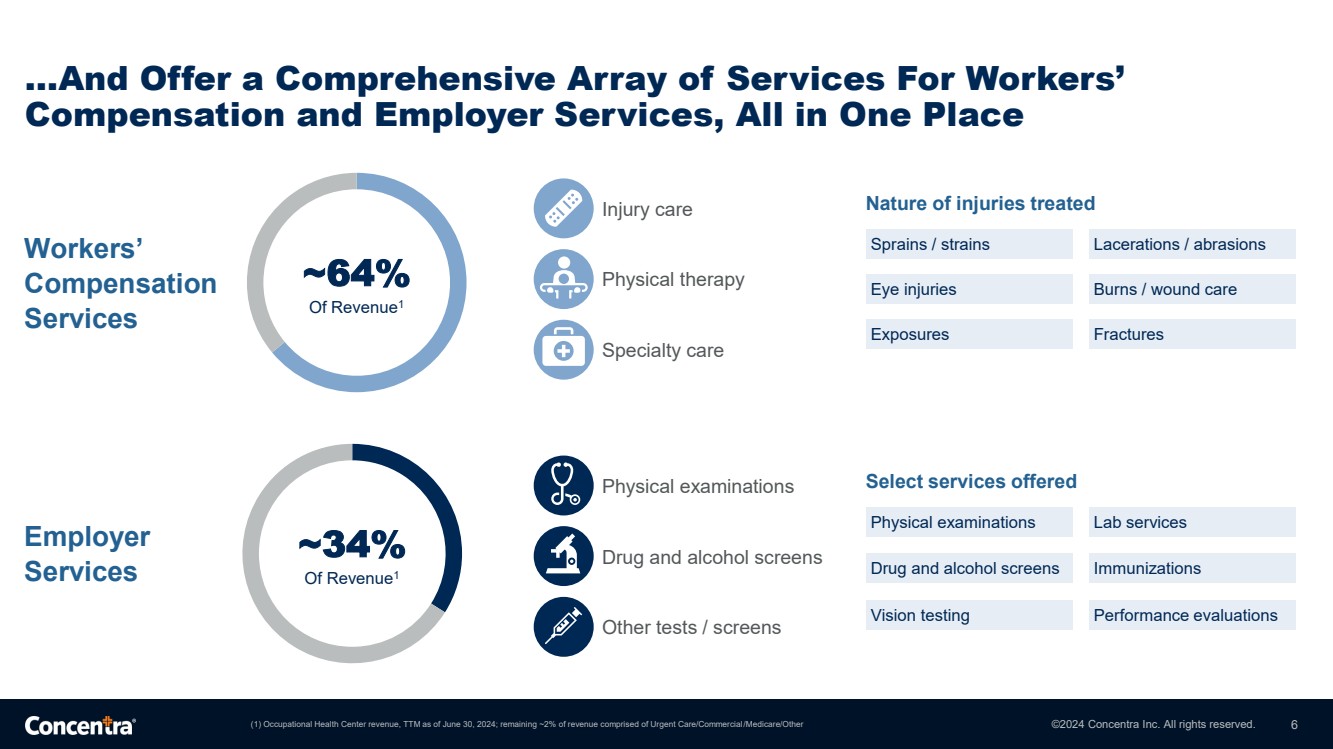
©2024 Concentra Inc. All rights reserved. …And Offer a Comprehensive Array of Services For Workers’ Compensation and Employer Services, All in One Place 6 Nature of injuries treated Sprains / strains Lacerations / abrasions Eye injuries Burns / wound care Exposures Fractures Select services offered Drug and alcohol screens Immunizations Physical examinations Lab services Vision testing Performance evaluations Workers’ Compensation Services Employer Services (1) Occupational Health Center revenue, TTM as of June 30, 2024; remaining ~2% of revenue comprised of Urgent Care/Commercial/Medicare/Other ~64% Of Revenue1 ~34% Of Revenue1 Other tests / screens Physical examinations Drug and alcohol screens Injury care Physical therapy Specialty care |
|
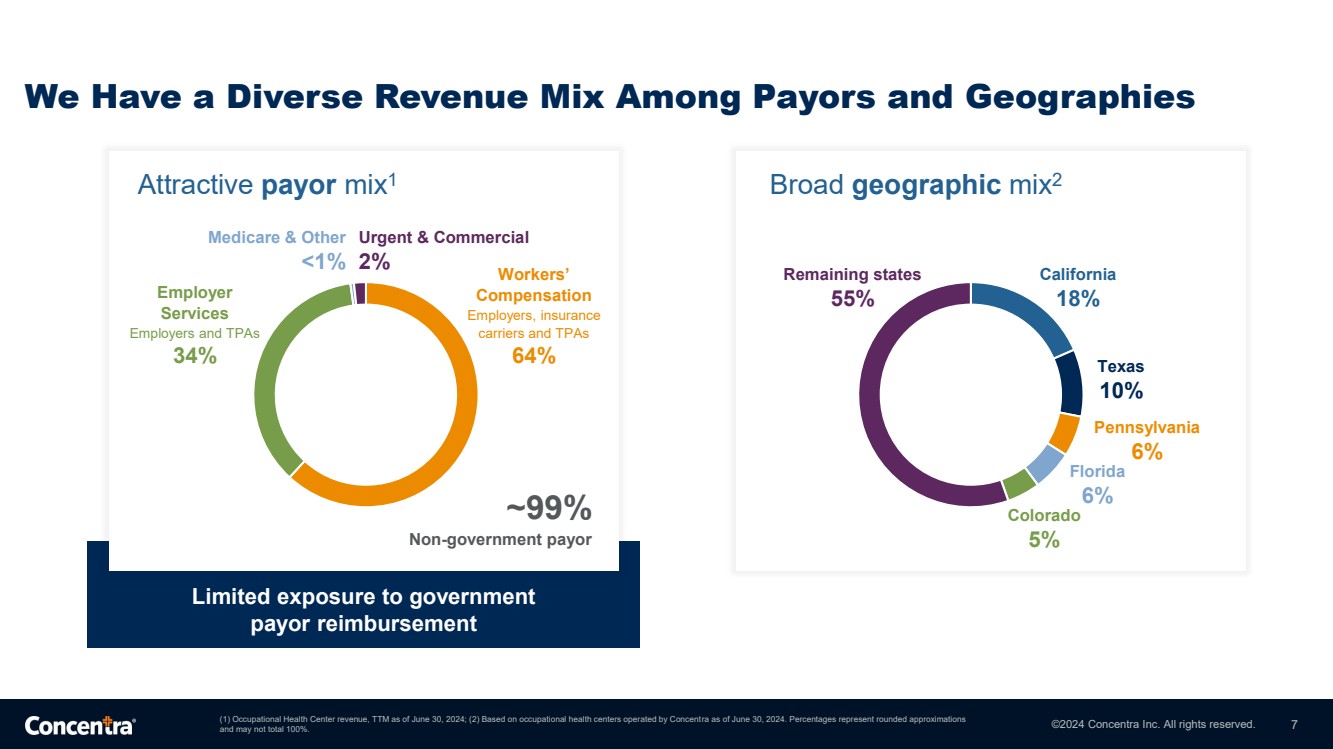
©2024 Concentra Inc. All rights reserved. We Have a Diverse Revenue Mix Among Payors and Geographies 7 (1) Occupational Health Center revenue, TTM as of June 30, 2024; (2) Based on occupational health centers operated by Concentra as of June 30, 2024. Percentages represent rounded approximations and may not total 100%. Broad geographic mix2 Remaining states 55% California 18% Texas 10% Pennsylvania 6% Florida 6% Colorado 5% Limited exposure to government payor reimbursement Attractive payor mix1 ~99% Non-government payor Employer Services Employers and TPAs 34% Medicare & Other <1% Workers’ Compensation Employers, insurance carriers and TPAs 64% Urgent & Commercial 2% |
|
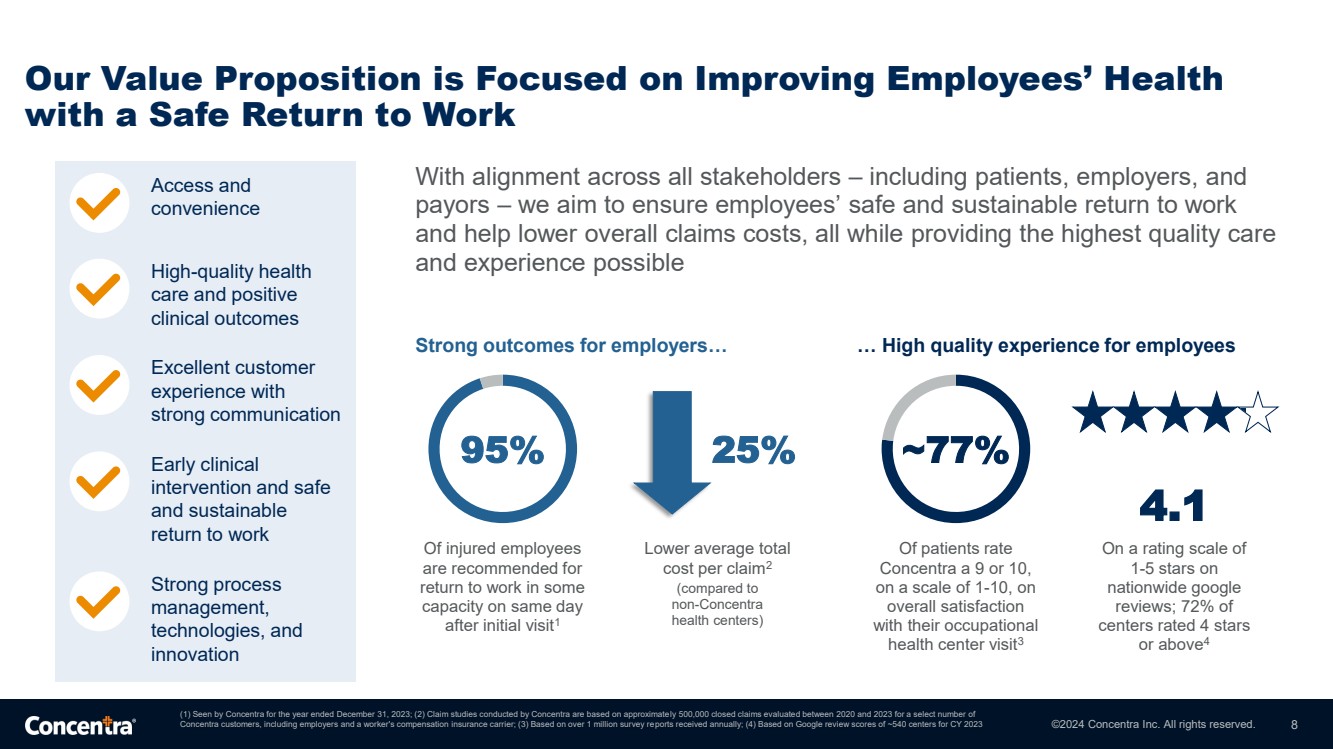
©2024 Concentra Inc. All rights reserved. Our Value Proposition is Focused on Improving Employees’ Health with a Safe Return to Work (1) Seen by Concentra for the year ended December 31, 2023; (2) Claim studies conducted by Concentra are based on approximately 500,000 closed claims evaluated between 2020 and 2023 for a select number of Concentra customers, including employers and a worker's compensation insurance carrier; (3) Based on over 1 million survey reports received annually; (4) Based on Google review scores of ~540 centers for CY 2023 8 With alignment across all stakeholders – including patients, employers, and payors – we aim to ensure employees’ safe and sustainable return to work and help lower overall claims costs, all while providing the highest quality care and experience possible Access and convenience High-quality health care and positive clinical outcomes Excellent customer experience with strong communication Early clinical intervention and safe and sustainable return to work Strong process management, technologies, and innovation Strong outcomes for employers… … High quality experience for employees Of injured employees are recommended for return to work in some capacity on same day after initial visit1 95% Of patients rate Concentra a 9 or 10, on a scale of 1-10, on overall satisfaction with their occupational health center visit3 ~77% On a rating scale of 1-5 stars on nationwide google reviews; 72% of centers rated 4 stars or above4 4.1 Lower average total cost per claim2 (compared to non-Concentra health centers) 25% |
|
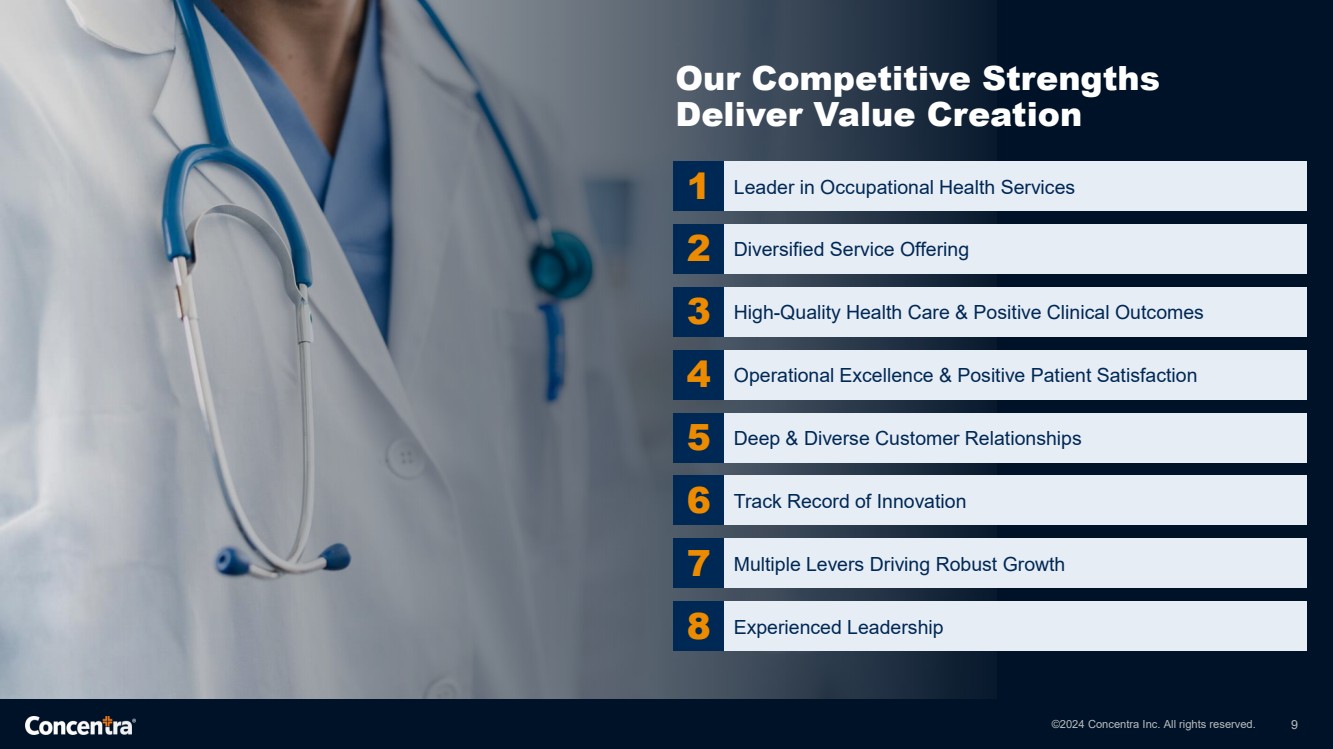
©2024 Concentra Inc. All rights reserved. Our Competitive Strengths Deliver Value Creation 9 1 Leader in Occupational Health Services 6 Track Record of Innovation 7 Multiple Levers Driving Robust Growth 8 Experienced Leadership 3 High-Quality Health Care & Positive Clinical Outcomes 2 Diversified Service Offering 4 Operational Excellence & Positive Patient Satisfaction 5 Deep & Diverse Customer Relationships |
|
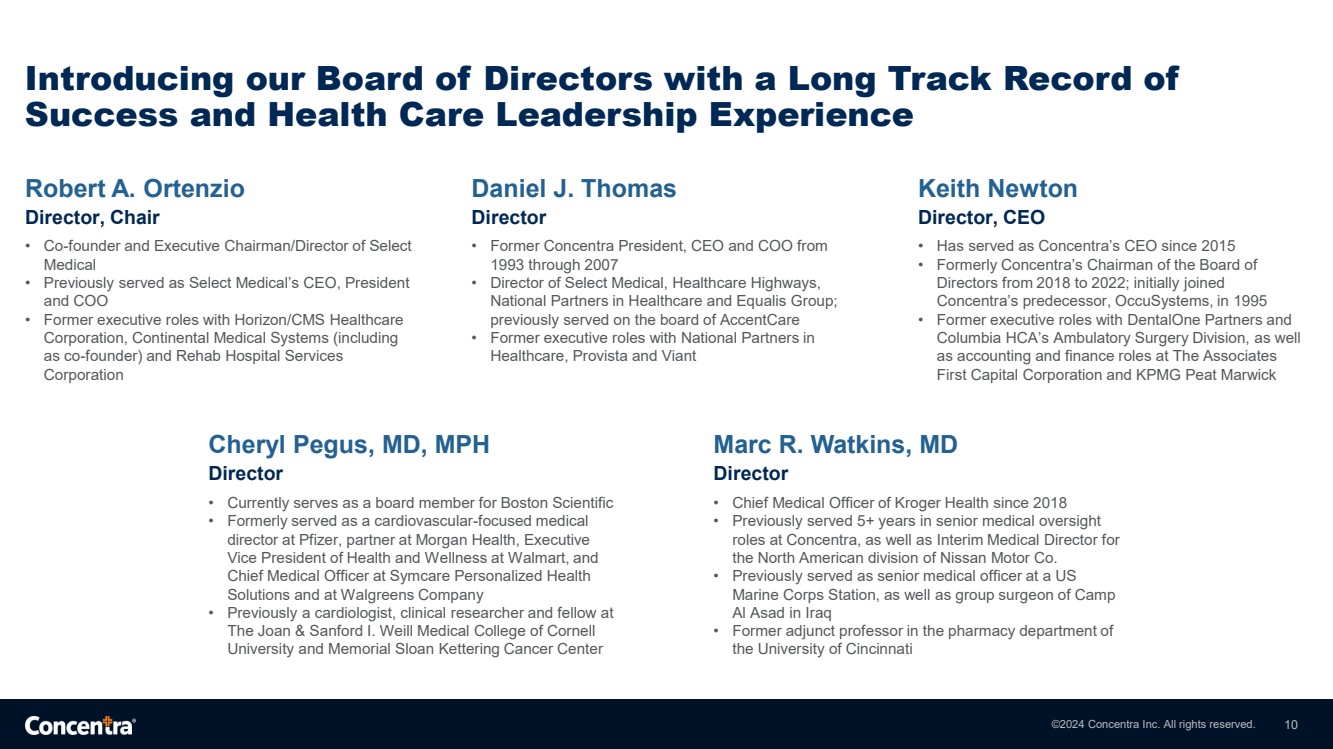
©2024 Concentra Inc. All rights reserved. Introducing our Board of Directors with a Long Track Record of Success and Health Care Leadership Experience 10 Cheryl Pegus, MD, MPH Director • Currently serves as a board member for Boston Scientific • Formerly served as a cardiovascular-focused medical director at Pfizer, partner at Morgan Health, Executive Vice President of Health and Wellness at Walmart, and Chief Medical Officer at Symcare Personalized Health Solutions and at Walgreens Company • Previously a cardiologist, clinical researcher and fellow at The Joan & Sanford I. Weill Medical College of Cornell University and Memorial Sloan Kettering Cancer Center Marc R. Watkins, MD Director • Chief Medical Officer of Kroger Health since 2018 • Previously served 5+ years in senior medical oversight roles at Concentra, as well as Interim Medical Director for the North American division of Nissan Motor Co. • Previously served as senior medical officer at a US Marine Corps Station, as well as group surgeon of Camp Al Asad in Iraq • Former adjunct professor in the pharmacy department of the University of Cincinnati Robert A. Ortenzio Director, Chair • Co-founder and Executive Chairman/Director of Select Medical • Previously served as Select Medical’s CEO, President and COO • Former executive roles with Horizon/CMS Healthcare Corporation, Continental Medical Systems (including as co-founder) and Rehab Hospital Services Corporation Keith Newton Director, CEO • Has served as Concentra’s CEO since 2015 • Formerly Concentra’s Chairman of the Board of Directors from 2018 to 2022; initially joined Concentra’s predecessor, OccuSystems, in 1995 • Former executive roles with DentalOne Partners and Columbia HCA’s Ambulatory Surgery Division, as well as accounting and finance roles at The Associates First Capital Corporation and KPMG Peat Marwick Daniel J. Thomas Director • Former Concentra President, CEO and COO from 1993 through 2007 • Director of Select Medical, Healthcare Highways, National Partners in Healthcare and Equalis Group; previously served on the board of AccentCare • Former executive roles with National Partners in Healthcare, Provista and Viant |
|
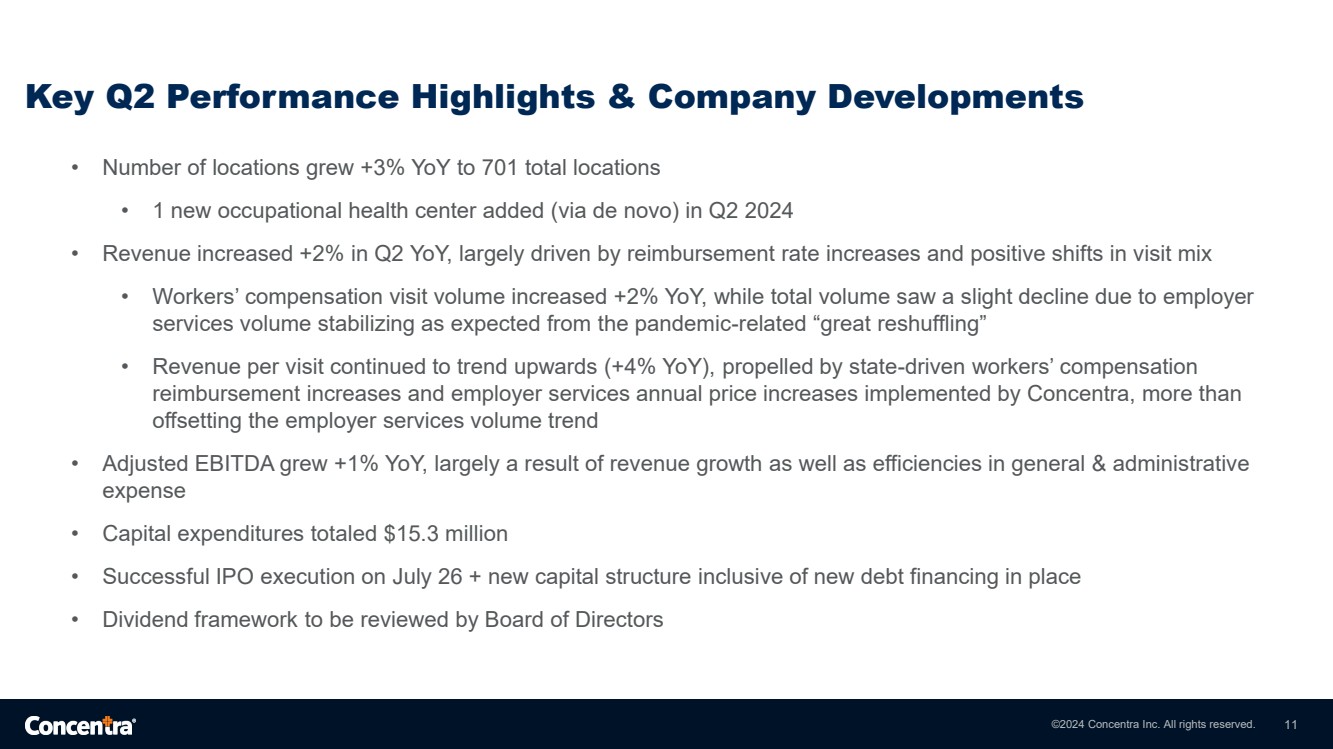
©2024 Concentra Inc. All rights reserved. • Number of locations grew +3% YoY to 701 total locations • 1 new occupational health center added (via de novo) in Q2 2024 • Revenue increased +2% in Q2 YoY, largely driven by reimbursement rate increases and positive shifts in visit mix • Workers’ compensation visit volume increased +2% YoY, while total volume saw a slight decline due to employer services volume stabilizing as expected from the pandemic-related “great reshuffling” • Revenue per visit continued to trend upwards (+4% YoY), propelled by state-driven workers’ compensation reimbursement increases and employer services annual price increases implemented by Concentra, more than offsetting the employer services volume trend • Adjusted EBITDA grew +1% YoY, largely a result of revenue growth as well as efficiencies in general & administrative expense • Capital expenditures totaled $15.3 million • Successful IPO execution on July 26 + new capital structure inclusive of new debt financing in place • Dividend framework to be reviewed by Board of Directors 11 Key Q2 Performance Highlights & Company Developments |
|
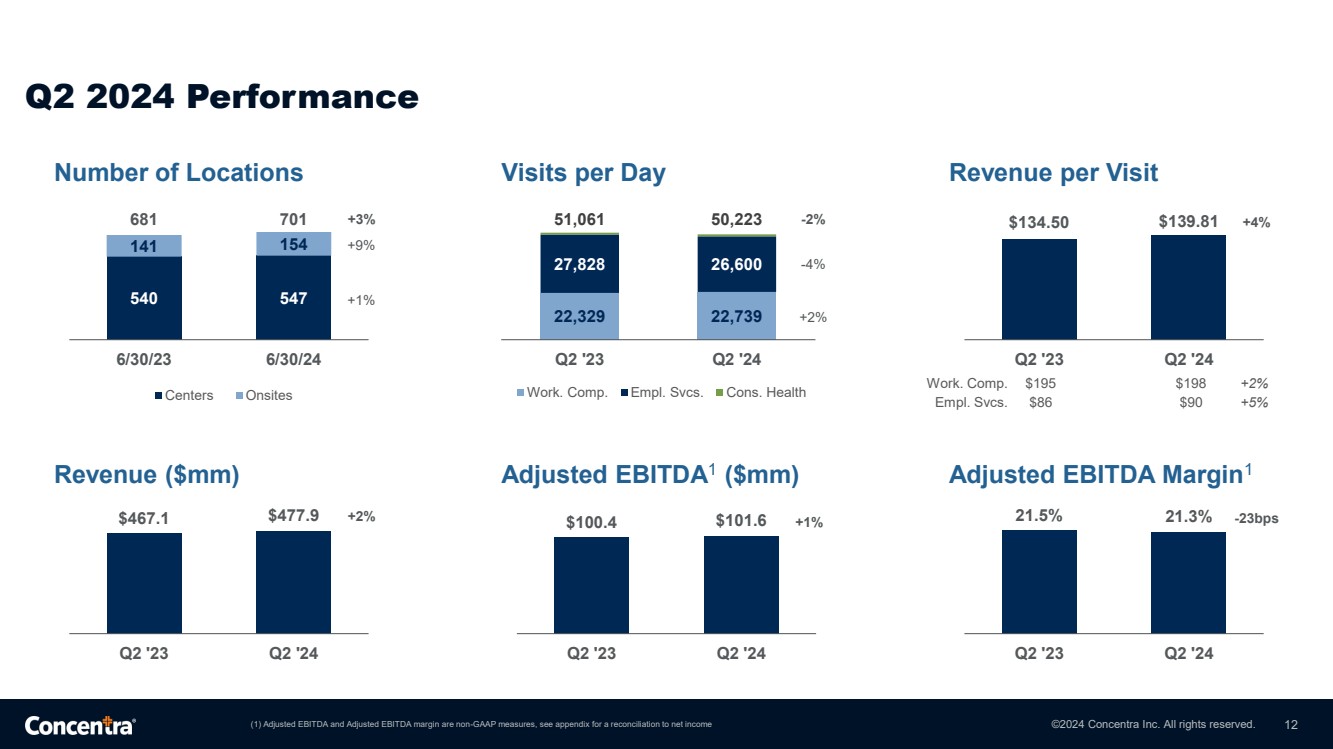
©2024 Concentra Inc. All rights reserved. Q2 2024 Performance (1) Adjusted EBITDA and Adjusted EBITDA margin are non-GAAP measures, see appendix for a reconciliation to net income 12 540 547 141 154 681 701 6/30/23 6/30/24 Centers Onsites +1% +9% +3% Number of Locations 22,329 22,739 27,828 26,600 51,061 50,223 Q2 '23 Q2 '24 Work. Comp. Empl. Svcs. Cons. Health +2% -4% -2% Visits per Day $467.1 $477.9 Q2 '23 Q2 '24 +2% Revenue ($mm) $100.4 $101.6 Q2 '23 Q2 '24 +1% Adjusted EBITDA1 ($mm) 21.5% 21.3% Q2 '23 Q2 '24 -23bps Adjusted EBITDA Margin1 $134.50 $139.81 Q2 '23 Q2 '24 +4% Revenue per Visit Work. Comp. Empl. Svcs. $195 $86 $198 $90 +2% +5% |
|
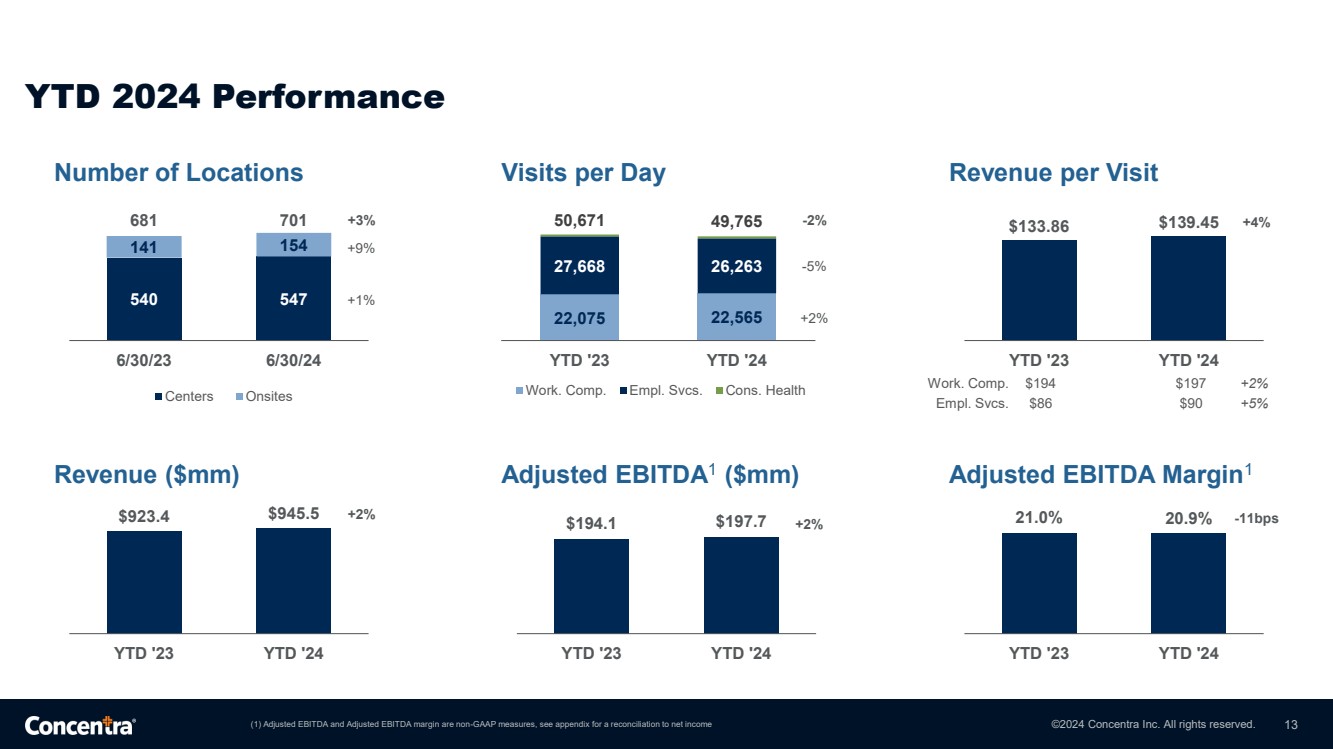
©2024 Concentra Inc. All rights reserved. YTD 2024 Performance (1) Adjusted EBITDA and Adjusted EBITDA margin are non-GAAP measures, see appendix for a reconciliation to net income 13 540 547 141 154 681 701 6/30/23 6/30/24 Centers Onsites +1% +9% +3% 22,075 22,565 27,668 26,263 50,671 49,765 YTD '23 YTD '24 Work. Comp. Empl. Svcs. Cons. Health +2% -5% -2% $923.4 $945.5 YTD '23 YTD '24 +2% Revenue ($mm) $194.1 $197.7 YTD '23 YTD '24 +2% Adjusted EBITDA1 ($mm) 21.0% 20.9% YTD '23 YTD '24 -11bps Adjusted EBITDA Margin1 $133.86 $139.45 YTD '23 YTD '24 +4% Work. Comp. Empl. Svcs. $194 $86 $197 $90 +2% +5% Number of Locations Visits per Day Revenue per Visit |
|
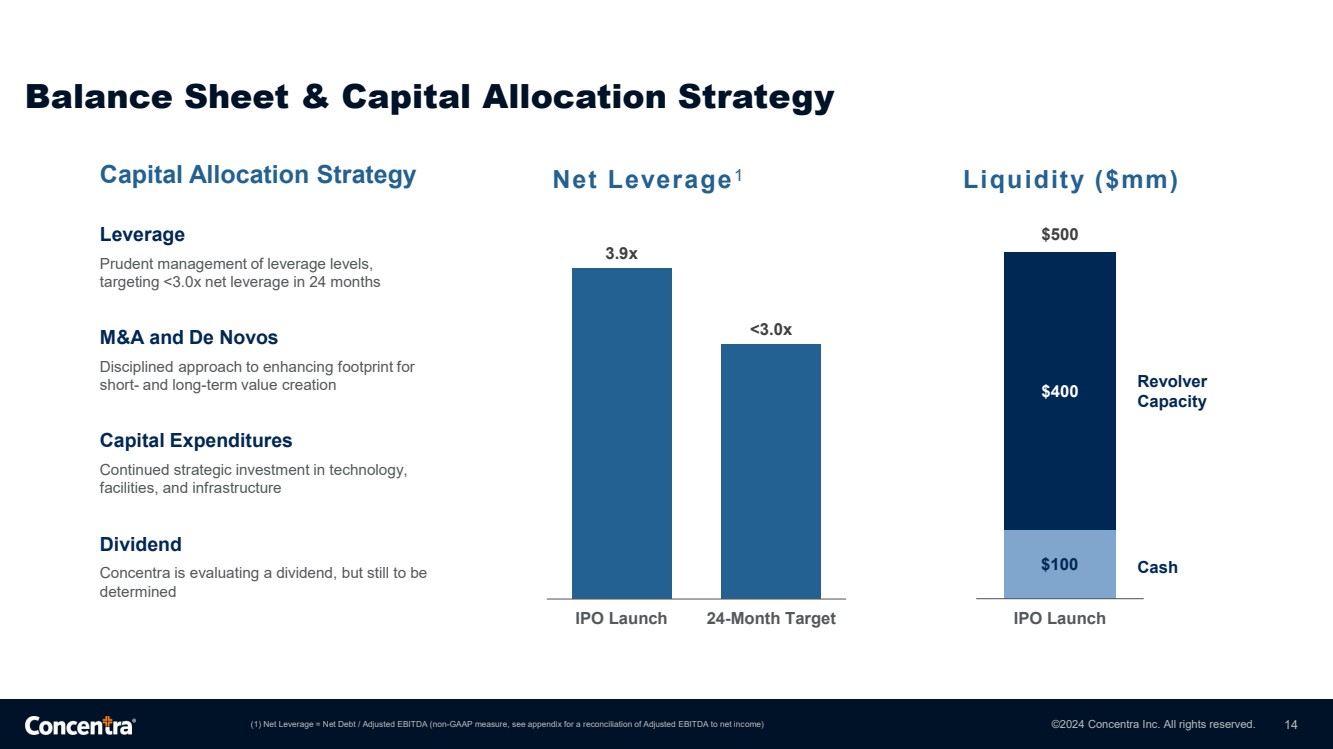
©2024 Concentra Inc. All rights reserved. Balance Sheet & Capital Allocation Strategy (1) Net Leverage = Net Debt / Adjusted EBITDA (non-GAAP measure, see appendix for a reconciliation of Adjusted EBITDA to net income) 14 Capital Allocation Strategy Leverage Prudent management of leverage levels, targeting <3.0x net leverage in 24 months M&A and De Novos Disciplined approach to enhancing footprint for short- and long-term value creation Capital Expenditures Continued strategic investment in technology, facilities, and infrastructure Dividend Concentra is evaluating a dividend, but still to be determined Net Leverage1 3.9x <3.0x IPO Launch 24-Month Target Liquidity ($mm) $100 $400 $500 IPO Launch Cash Revolver Capacity |
|
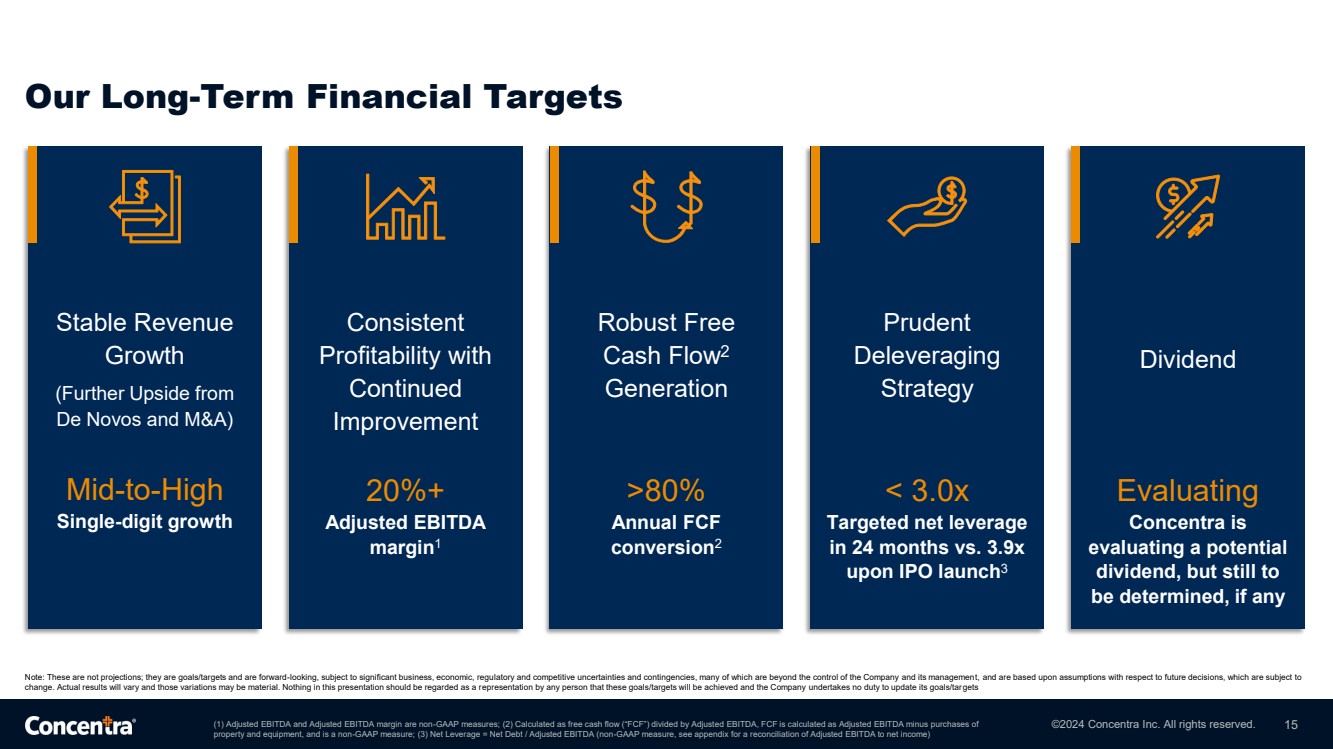
©2024 Concentra Inc. All rights reserved. Our Long-Term Financial Targets (1) Adjusted EBITDA and Adjusted EBITDA margin are non-GAAP measures; (2) Calculated as free cash flow (“FCF”) divided by Adjusted EBITDA, FCF is calculated as Adjusted EBITDA minus purchases of property and equipment, and is a non-GAAP measure; (3) Net Leverage = Net Debt / Adjusted EBITDA (non-GAAP measure, see appendix for a reconciliation of Adjusted EBITDA to net income) 15 Consistent Profitability with Continued Improvement 20%+ Adjusted EBITDA margin1 Robust Free Cash Flow2 Generation >80% Annual FCF conversion2 Prudent Deleveraging Strategy < 3.0x Targeted net leverage in 24 months vs. 3.9x upon IPO launch3 Stable Revenue Growth (Further Upside from De Novos and M&A) Mid-to-High Single-digit growth Dividend Evaluating Concentra is evaluating a potential dividend, but still to be determined, if any Note: These are not projections; they are goals/targets and are forward-looking, subject to significant business, economic, regulatory and competitive uncertainties and contingencies, many of which are beyond the control of the Company and its management, and are based upon assumptions with respect to future decisions, which are subject to change. Actual results will vary and those variations may be material. Nothing in this presentation should be regarded as a representation by any person that these goals/targets will be achieved and the Company undertakes no duty to update its goals/targets |
|
©2024 Concentra Inc. All rights reserved. APPENDIX 16 |

|
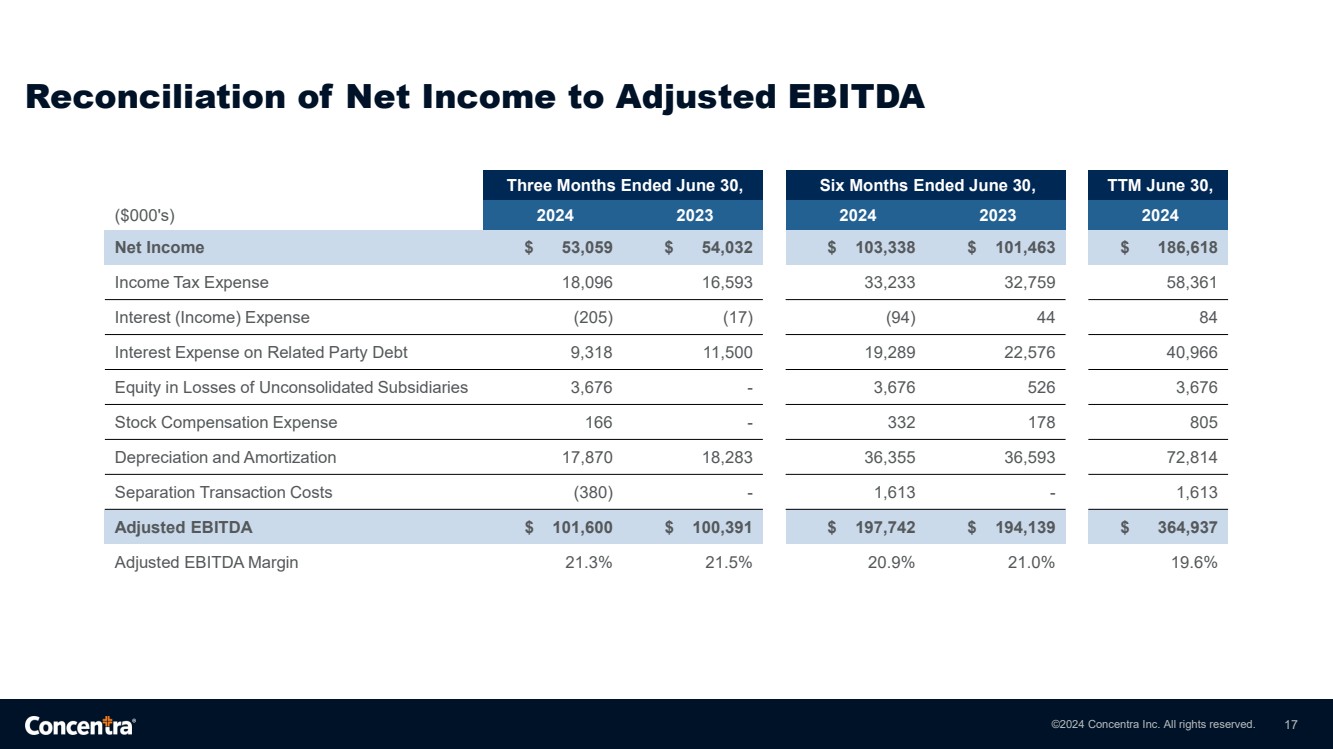
©2024 Concentra Inc. All rights reserved. Reconciliation of Net Income to Adjusted EBITDA 17 Three Months Ended June 30, Six Months Ended June 30, TTM June 30, ($000's) 2024 2023 2024 2023 2024 Net Income $ 53,059 $ 54,032 $ 103,338 $ 101,463 $ 186,618 Income Tax Expense 18,096 16,593 33,233 32,759 58,361 Interest (Income) Expense (205) (17) (94) 44 84 Interest Expense on Related Party Debt 9,318 11,500 19,289 22,576 40,966 Equity in Losses of Unconsolidated Subsidiaries 3,676 - 3,676 526 3,676 Stock Compensation Expense 166 - 332 178 805 Depreciation and Amortization 17,870 18,283 36,355 36,593 72,814 Separation Transaction Costs (380) - 1,613 - 1,613 Adjusted EBITDA $ 101,600 $ 100,391 $ 197,742 $ 194,139 $ 364,937 Adjusted EBITDA Margin 21.3% 21.5% 20.9% 21.0% 19.6% |
|