EX-99.2
Published on August 6, 2026
©2026 Concentra Inc. All rights reserved. 2nd Quarter 2026 Results August 6, 2026
©2026 Concentra Inc. All rights reserved. Forward-Looking Statements This presentation contains forward-looking statements that express Concentra Group Holdings Parent, Inc.'s ("Concentra," the "Company," "we" or "our") current opinions, expectations, beliefs, plans, objectives, assumptions or projections regarding future events or future results that include, but are not limited to, financial guidance and other projections and forecasts. Forward looking statements include statements that are not historical facts and can be identified by terms such as “anticipate,” “believe,” “could,” “estimate,” “expect,” “intend,” “may,” “plan,” “potential,” “predict,” “project,” “seek,” “should,” “will,” “would” or similar expressions and the negatives of those terms. These forward-looking statements involve a number of risks, uncertainties (some of which are beyond the Company’s control) or other assumptions that may cause actual results or performance to be materially different from those expressed or implied by these forward- looking statements. These risks and uncertainties include, but are not limited to, those factors described in the Company’s filings with the Securities and Exchange Commission (“SEC”), including those under “Risk Factors” therein. Should one or more of these risks or uncertainties materialize, or should any of the assumptions prove incorrect, actual results may vary in material respects from those projected in these forward-looking statements. Actual results may differ materially from these expectations due to changes in global, regional or local economic, business, competitive, market, regulatory and other factors, many of which are beyond the Company’s control. Any forward looking statements made by the Company in this presentation speak only as of the date of this presentation and are expressly qualified in their entirety by the cautionary statements included in this presentation. Factors or events that could cause the Company’s actual results to differ may emerge from time to time, and it is not possible for the Company to predict all of them. The Company may not actually achieve the plans, intentions or expectations disclosed in its forward looking statements and you should not place undue reliance on its forward looking statements. The Company’s forward looking statements do not reflect the potential impact of any future acquisitions, mergers, dispositions, joint ventures, investments or other strategic transactions it may make. The Company does not undertake any obligation to update or revise any forward-looking statements, whether as a result of new information, future events or otherwise, except as may be required under applicable securities laws. Use of Non-GAAP Financial Information In order to provide investors with greater insight, promote transparency and allow for a more comprehensive understanding of the information used by management in its financial and operational decision making, the Company supplements its condensed consolidated financial statements presented on a GAAP basis herein with certain non-GAAP financial information, including reconciliations of these non-GAAP measures to their most directly comparable available GAAP measures, which are included in this presentation, as well as in the Company’s quarterly financial press releases and related Form 8-K filings with the SEC. This information can be accessed for free by visiting www.concentra.com or www.sec.gov. We believe that the presentation of Adjusted EBITDA, Adjusted EBITDA margin, Return on Invested Capital, Free Cash Flow and FCF Conversion, as defined herein (collectively, the “Non-GAAP Measures”), are important to investors because they are commonly used as an analytical indicator of performance by investors within the healthcare industry. The Non-GAAP Measures are used by management to evaluate financial performance of, and determine resource allocation for, each of our operating segments. However, the Non-GAAP Measures are not measures of financial performance under U.S. GAAP. Items excluded from the Non-GAAP Measures are significant components in understanding and assessing financial performance. The Non-GAAP Measures should not be considered in isolation, or as an alternative to, or substitute for, net income, net income margin, income from operations, cash flows generated by operations, investing or financing activities, or other financial statement data presented in the consolidated financial statements as indicators of financial performance or liquidity. Because the Non-GAAP Measures are not measurements determined in accordance with U.S. GAAP and are thus susceptible to varying definitions, the Non-GAAP Measures as presented may not be comparable to other similarly titled measures of other companies. We define Adjusted EBITDA as earnings excluding interest, income taxes, depreciation and amortization, gain (loss) on early retirement of debt, stock compensation expense, separation transaction costs, and Nova Medical Centers (“Nova”) and Onsite Innovations, LLC (“Pivot Onsite Innovations”) acquisition costs. We define Adjusted EBITDA margin as Adjusted EBITDA divided by revenue. We define Return on Invested Capital as net operating profit after tax divided by average invested capital. We define Free Cash Flow as cash flow from operations less cash flow from investing activity (excluding business combinations, net of cash acquired). We define FCF Conversion as Free Cash Flow divided by net income. We will refer to the Non-GAAP Measures throughout these materials. Disclaimer 2
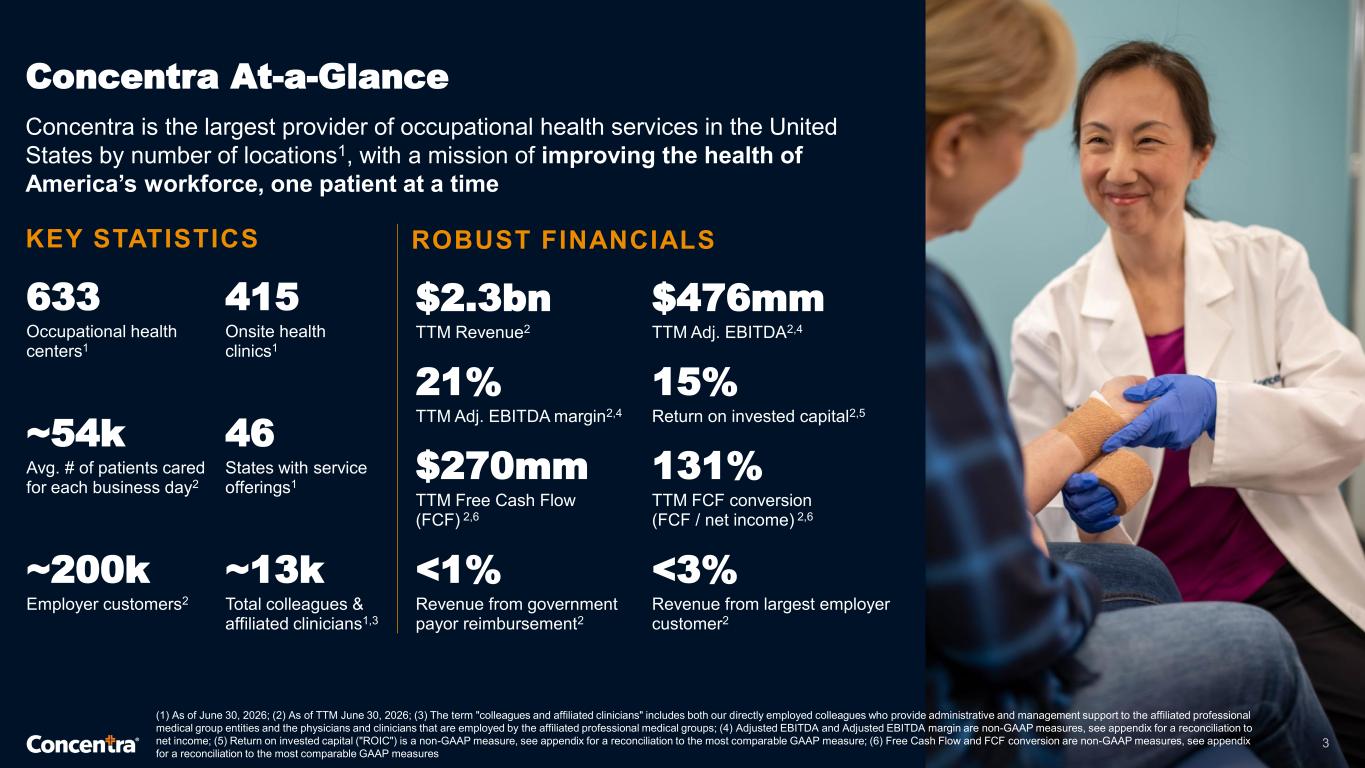
©2026 Concentra Inc. All rights reserved. Concentra At-a-Glance Concentra is the largest provider of occupational health services in the United States by number of locations1, with a mission of improving the health of America’s workforce, one patient at a time KEY STATISTICS ~13k Total colleagues & affiliated clinicians1,3 ~200k Employer customers2 46 States with service offerings1 ~54k Avg. # of patients cared for each business day2 ROBUST FINANCIALS $2.3bn TTM Revenue2 $476mm TTM Adj. EBITDA2,4 415 Onsite health clinics1 633 Occupational health centers1 <1% Revenue from government payor reimbursement2 <3% Revenue from largest employer customer2 (1) As of June 30, 2026; (2) As of TTM June 30, 2026; (3) The term "colleagues and affiliated clinicians" includes both our directly employed colleagues who provide administrative and management support to the affiliated professional medical group entities and the physicians and clinicians that are employed by the affiliated professional medical groups; (4) Adjusted EBITDA and Adjusted EBITDA margin are non-GAAP measures, see appendix for a reconciliation to net income; (5) Return on invested capital ("ROIC") is a non-GAAP measure, see appendix for a reconciliation to the most comparable GAAP measure; (6) Free Cash Flow and FCF conversion are non-GAAP measures, see appendix for a reconciliation to the most comparable GAAP measures 21% TTM Adj. EBITDA margin2,4 15% Return on invested capital2,5 131% TTM FCF conversion (FCF / net income) 2,6 $270mm TTM Free Cash Flow (FCF) 2,6 3
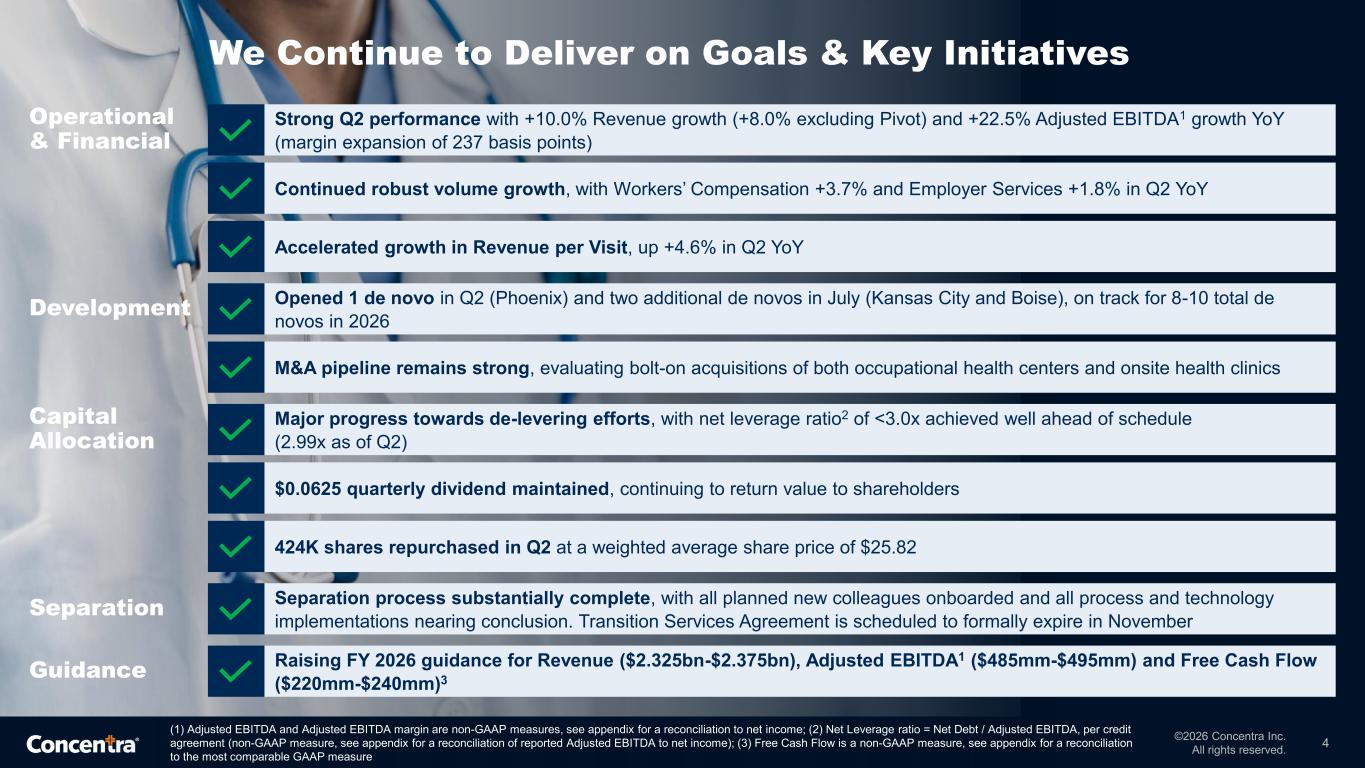
©2026 Concentra Inc. All rights reserved. We Continue to Deliver on Goals & Key Initiatives 4 M&A pipeline remains strong, evaluating bolt-on acquisitions of both occupational health centers and onsite health clinics Development Opened 1 de novo in Q2 (Phoenix) and two additional de novos in July (Kansas City and Boise), on track for 8-10 total de novos in 2026 Separation process substantially complete, with all planned new colleagues onboarded and all process and technology implementations nearing conclusion. Transition Services Agreement is scheduled to formally expire in November Separation Operational & Financial Strong Q2 performance with +10.0% Revenue growth (+8.0% excluding Pivot) and +22.5% Adjusted EBITDA1 growth YoY (margin expansion of 237 basis points) Continued robust volume growth, with Workers’ Compensation +3.7% and Employer Services +1.8% in Q2 YoY Accelerated growth in Revenue per Visit, up +4.6% in Q2 YoY Capital Allocation Major progress towards de-levering efforts, with net leverage ratio2 of <3.0x achieved well ahead of schedule (2.99x as of Q2) $0.0625 quarterly dividend maintained, continuing to return value to shareholders 424K shares repurchased in Q2 at a weighted average share price of $25.82 (1) Adjusted EBITDA and Adjusted EBITDA margin are non-GAAP measures, see appendix for a reconciliation to net income; (2) Net Leverage ratio = Net Debt / Adjusted EBITDA, per credit agreement (non-GAAP measure, see appendix for a reconciliation of reported Adjusted EBITDA to net income); (3) Free Cash Flow is a non-GAAP measure, see appendix for a reconciliation to the most comparable GAAP measure Raising FY 2026 guidance for Revenue ($2.325bn-$2.375bn), Adjusted EBITDA1 ($485mm-$495mm) and Free Cash Flow ($220mm-$240mm)3 Guidance
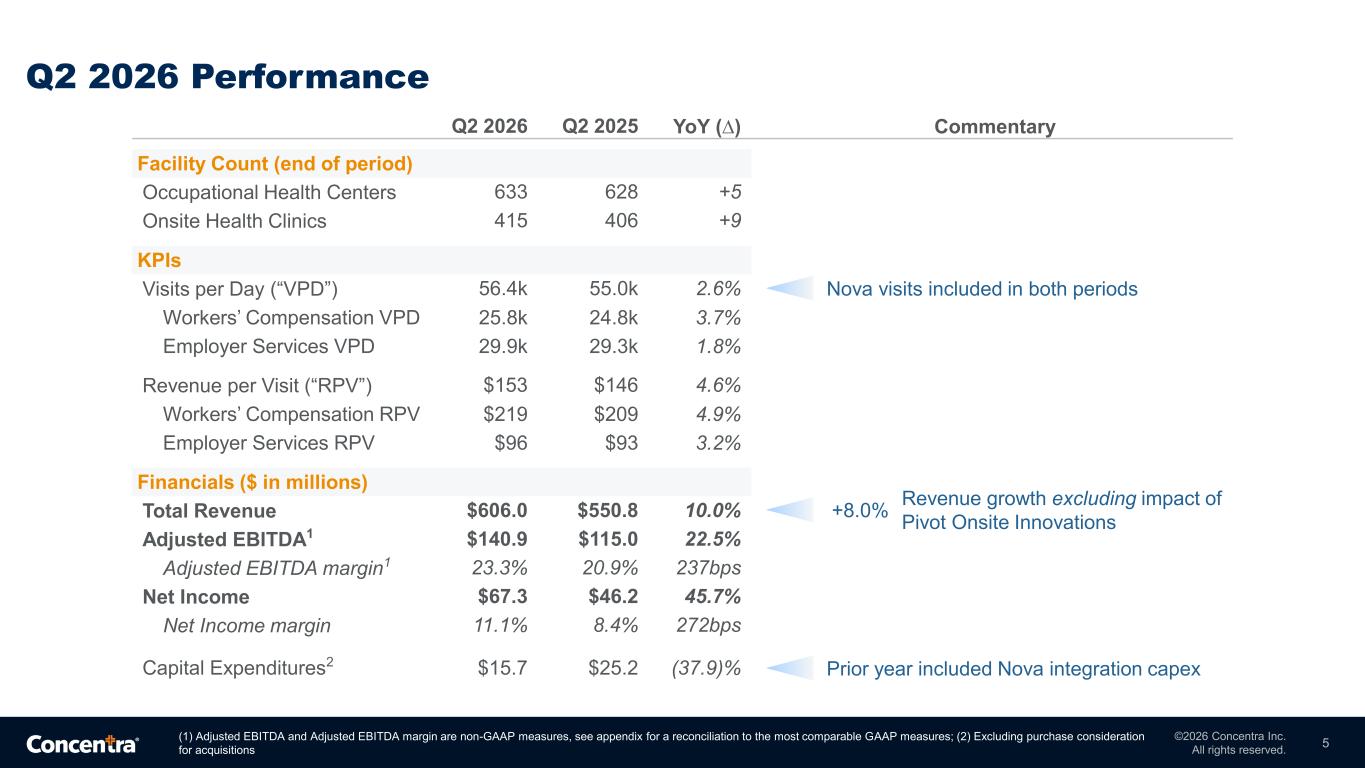
©2026 Concentra Inc. All rights reserved. 5 Q2 2026 Performance Q2 2026 Q2 2025 YoY (∆) Commentary Facility Count (end of period) Occupational Health Centers 633 628 +5 Onsite Health Clinics 415 406 +9 KPIs Visits per Day (“VPD”) 56.4k 55.0k 2.6% Workers’ Compensation VPD 25.8k 24.8k 3.7% Employer Services VPD 29.9k 29.3k 1.8% Revenue per Visit (“RPV”) $153 $146 4.6% Workers’ Compensation RPV $219 $209 4.9% Employer Services RPV $96 $93 3.2% Financials ($ in millions) Total Revenue $606.0 $550.8 10.0% Adjusted EBITDA1 $140.9 $115.0 22.5% Adjusted EBITDA margin1 23.3% 20.9% 237bps Net Income $67.3 $46.2 45.7% Net Income margin 11.1% 8.4% 272bps Capital Expenditures2 $15.7 $25.2 (37.9)% (1) Adjusted EBITDA and Adjusted EBITDA margin are non-GAAP measures, see appendix for a reconciliation to the most comparable GAAP measures; (2) Excluding purchase consideration for acquisitions Revenue growth excluding impact of Pivot Onsite Innovations +8.0% Nova visits included in both periods Prior year included Nova integration capex
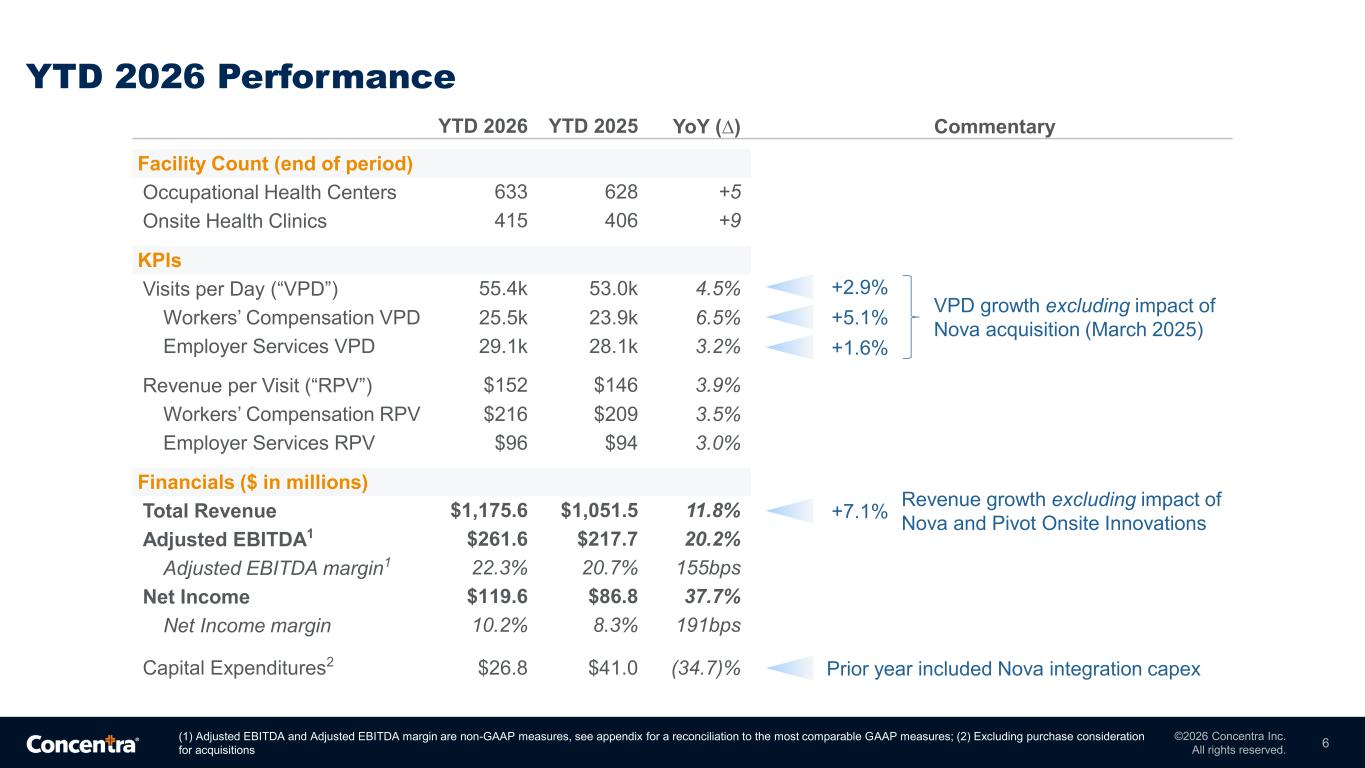
©2026 Concentra Inc. All rights reserved. 6 YTD 2026 Performance YTD 2026 YTD 2025 YoY (∆) Commentary Facility Count (end of period) Occupational Health Centers 633 628 +5 Onsite Health Clinics 415 406 +9 KPIs Visits per Day (“VPD”) 55.4k 53.0k 4.5% Workers’ Compensation VPD 25.5k 23.9k 6.5% Employer Services VPD 29.1k 28.1k 3.2% Revenue per Visit (“RPV”) $152 $146 3.9% Workers’ Compensation RPV $216 $209 3.5% Employer Services RPV $96 $94 3.0% Financials ($ in millions) Total Revenue $1,175.6 $1,051.5 11.8% Adjusted EBITDA1 $261.6 $217.7 20.2% Adjusted EBITDA margin1 22.3% 20.7% 155bps Net Income $119.6 $86.8 37.7% Net Income margin 10.2% 8.3% 191bps Capital Expenditures2 $26.8 $41.0 (34.7)% (1) Adjusted EBITDA and Adjusted EBITDA margin are non-GAAP measures, see appendix for a reconciliation to the most comparable GAAP measures; (2) Excluding purchase consideration for acquisitions Revenue growth excluding impact of Nova and Pivot Onsite Innovations +7.1% +2.9% +5.1% +1.6% VPD growth excluding impact of Nova acquisition (March 2025) Prior year included Nova integration capex
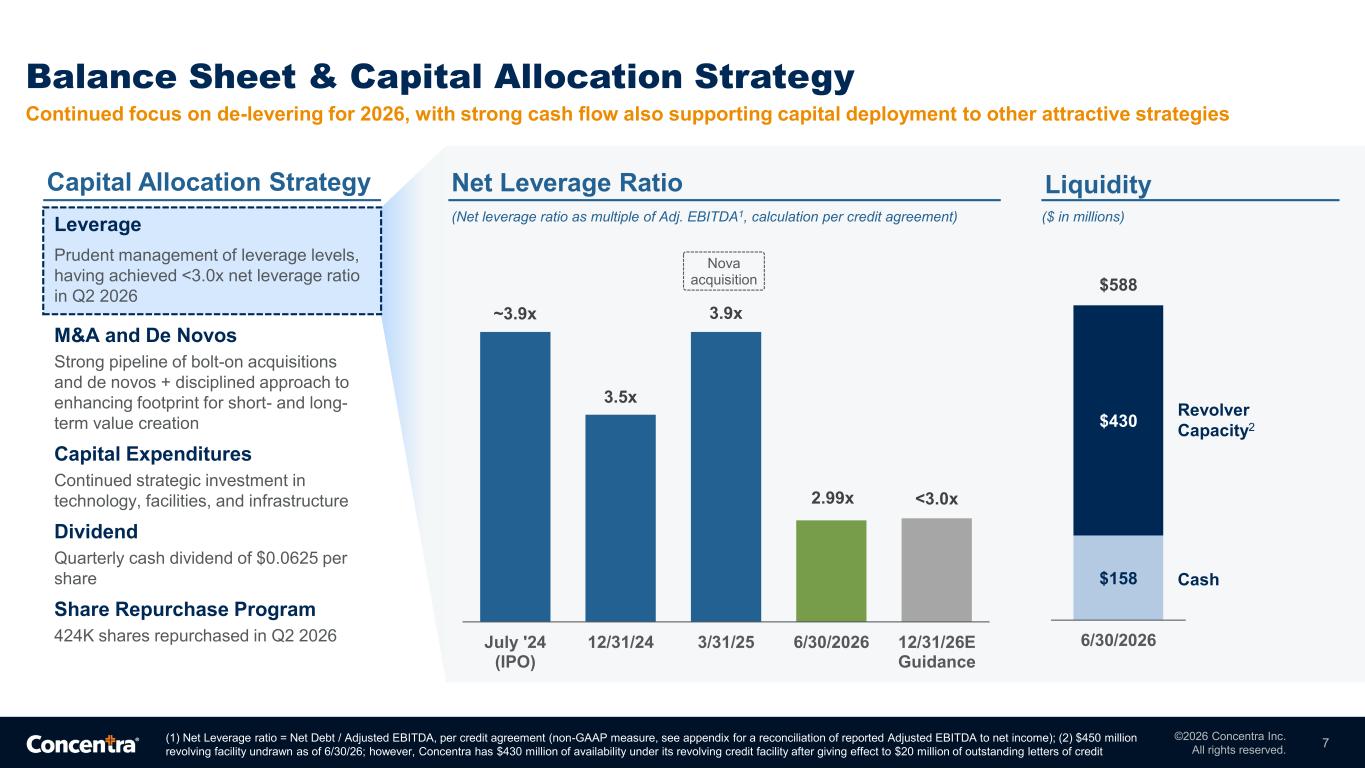
©2026 Concentra Inc. All rights reserved. Balance Sheet & Capital Allocation Strategy 7 Leverage Prudent management of leverage levels, having achieved <3.0x net leverage ratio in Q2 2026 M&A and De Novos Strong pipeline of bolt-on acquisitions and de novos + disciplined approach to enhancing footprint for short- and long- term value creation Capital Expenditures Continued strategic investment in technology, facilities, and infrastructure Dividend Quarterly cash dividend of $0.0625 per share Share Repurchase Program 424K shares repurchased in Q2 2026 Net Leverage Ratio Liquidity $158 $430 $588 6/30/2026 Cash Revolver Capacity2 ($ in millions) (1) Net Leverage ratio = Net Debt / Adjusted EBITDA, per credit agreement (non-GAAP measure, see appendix for a reconciliation of reported Adjusted EBITDA to net income); (2) $450 million revolving facility undrawn as of 6/30/26; however, Concentra has $430 million of availability under its revolving credit facility after giving effect to $20 million of outstanding letters of credit Capital Allocation Strategy (Net leverage ratio as multiple of Adj. EBITDA1, calculation per credit agreement) Continued focus on de-levering for 2026, with strong cash flow also supporting capital deployment to other attractive strategies ~3.9x 3.5x 3.9x 2.99x <3.0x July '24 (IPO) 12/31/24 3/31/25 6/30/2026 12/31/26E Guidance Nova acquisition Note: removed footnote on shares repurchased “Includes shares repurchased under the share repurchase program and shares withheld in connection with tax payments related to the vesting of employee restricted stock awards” – because there were no vestings during Q1
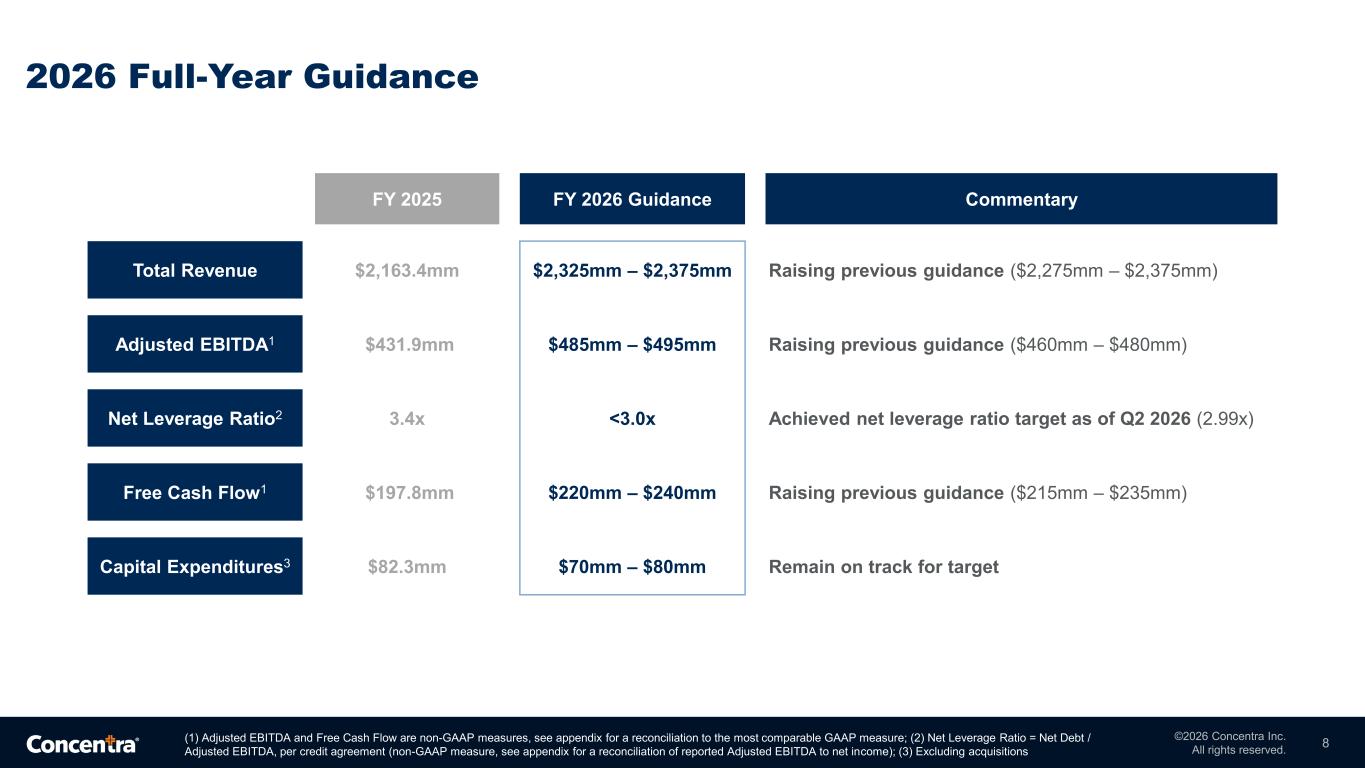
©2026 Concentra Inc. All rights reserved. 2026 Full-Year Guidance 8(1) Adjusted EBITDA and Free Cash Flow are non-GAAP measures, see appendix for a reconciliation to the most comparable GAAP measure; (2) Net Leverage Ratio = Net Debt / Adjusted EBITDA, per credit agreement (non-GAAP measure, see appendix for a reconciliation of reported Adjusted EBITDA to net income); (3) Excluding acquisitions FY 2025 FY 2026 Guidance Commentary Total Revenue $2,163.4mm $2,325mm – $2,375mm Raising previous guidance ($2,275mm – $2,375mm) Adjusted EBITDA1 $431.9mm $485mm – $495mm Raising previous guidance ($460mm – $480mm) Net Leverage Ratio2 3.4x <3.0x Achieved net leverage ratio target as of Q2 2026 (2.99x) Free Cash Flow1 $197.8mm $220mm – $240mm Raising previous guidance ($215mm – $235mm) Capital Expenditures3 $82.3mm $70mm – $80mm Remain on track for target

©2026 Concentra Inc. All rights reserved. Improving the health of America’s workforce, one patient at a time.
©2026 Concentra Inc. All rights reserved. Appendix
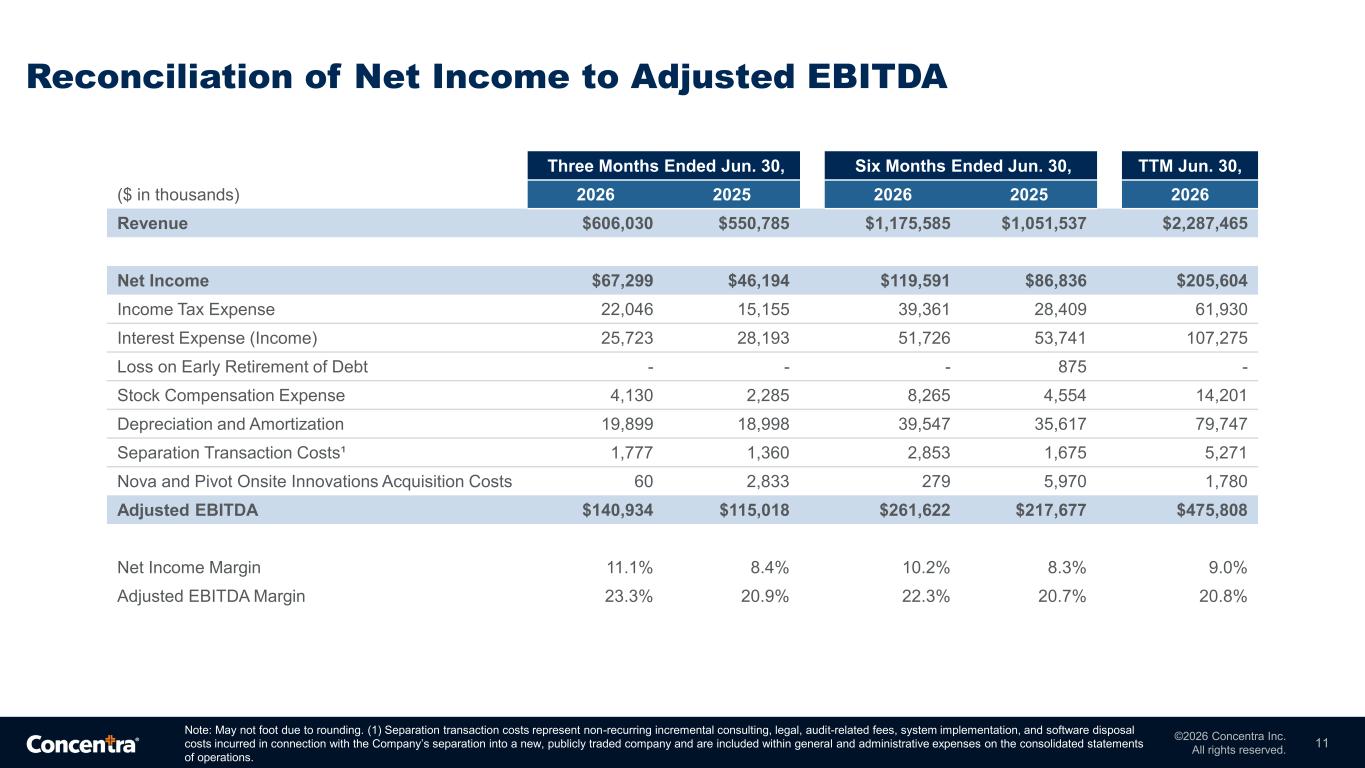
©2026 Concentra Inc. All rights reserved. Reconciliation of Net Income to Adjusted EBITDA 11 Three Months Ended Jun. 30, Six Months Ended Jun. 30, TTM Jun. 30, ($ in thousands) 2026 2025 2026 2025 2026 Revenue $606,030 $550,785 $1,175,585 $1,051,537 $2,287,465 Net Income $67,299 $46,194 $119,591 $86,836 $205,604 Income Tax Expense 22,046 15,155 39,361 28,409 61,930 Interest Expense (Income) 25,723 28,193 51,726 53,741 107,275 Loss on Early Retirement of Debt - - - 875 - Stock Compensation Expense 4,130 2,285 8,265 4,554 14,201 Depreciation and Amortization 19,899 18,998 39,547 35,617 79,747 Separation Transaction Costs¹ 1,777 1,360 2,853 1,675 5,271 Nova and Pivot Onsite Innovations Acquisition Costs 60 2,833 279 5,970 1,780 Adjusted EBITDA $140,934 $115,018 $261,622 $217,677 $475,808 Net Income Margin 11.1% 8.4% 10.2% 8.3% 9.0% Adjusted EBITDA Margin 23.3% 20.9% 22.3% 20.7% 20.8% Note: May not foot due to rounding. (1) Separation transaction costs represent non-recurring incremental consulting, legal, audit-related fees, system implementation, and software disposal costs incurred in connection with the Company’s separation into a new, publicly traded company and are included within general and administrative expenses on the consolidated statements of operations.
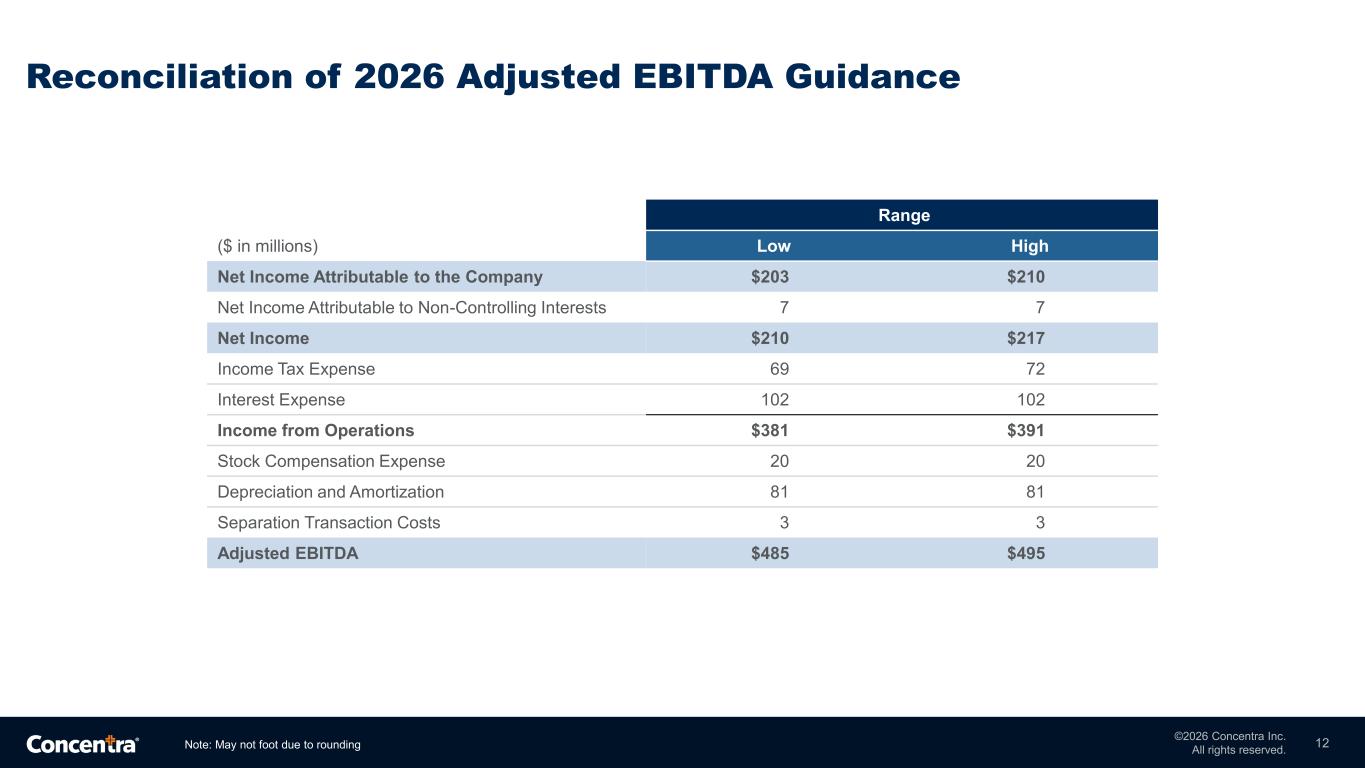
©2026 Concentra Inc. All rights reserved. Reconciliation of 2026 Adjusted EBITDA Guidance 12 Range ($ in millions) Low High Net Income Attributable to the Company $203 $210 Net Income Attributable to Non-Controlling Interests 7 7 Net Income $210 $217 Income Tax Expense 69 72 Interest Expense 102 102 Income from Operations $381 $391 Stock Compensation Expense 20 20 Depreciation and Amortization 81 81 Separation Transaction Costs 3 3 Adjusted EBITDA $485 $495 Note: May not foot due to rounding
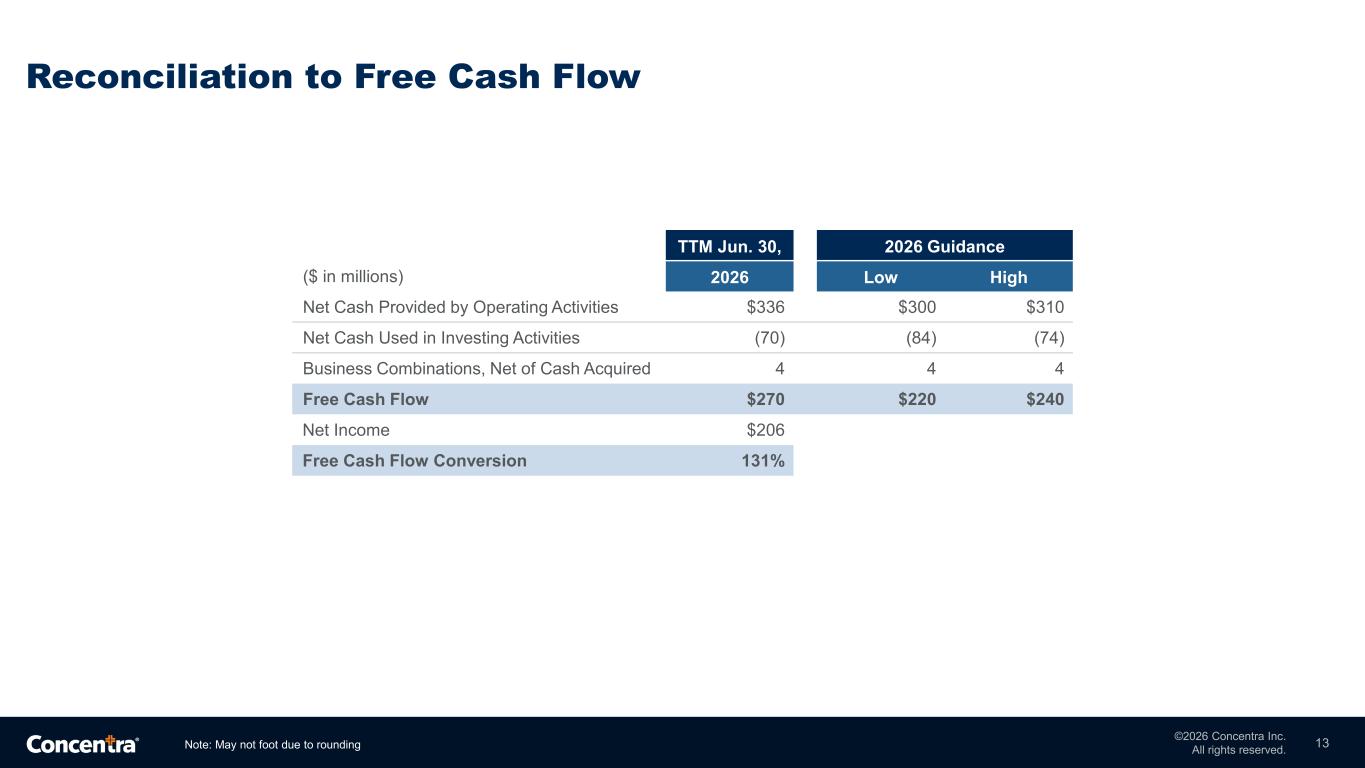
©2026 Concentra Inc. All rights reserved. Reconciliation to Free Cash Flow 13Note: May not foot due to rounding TTM Jun. 30, 2026 Guidance ($ in millions) 2026 Low High Net Cash Provided by Operating Activities $336 $300 $310 Net Cash Used in Investing Activities (70) (84) (74) Business Combinations, Net of Cash Acquired 4 4 4 Free Cash Flow $270 $220 $240 Net Income $206 Free Cash Flow Conversion 131%
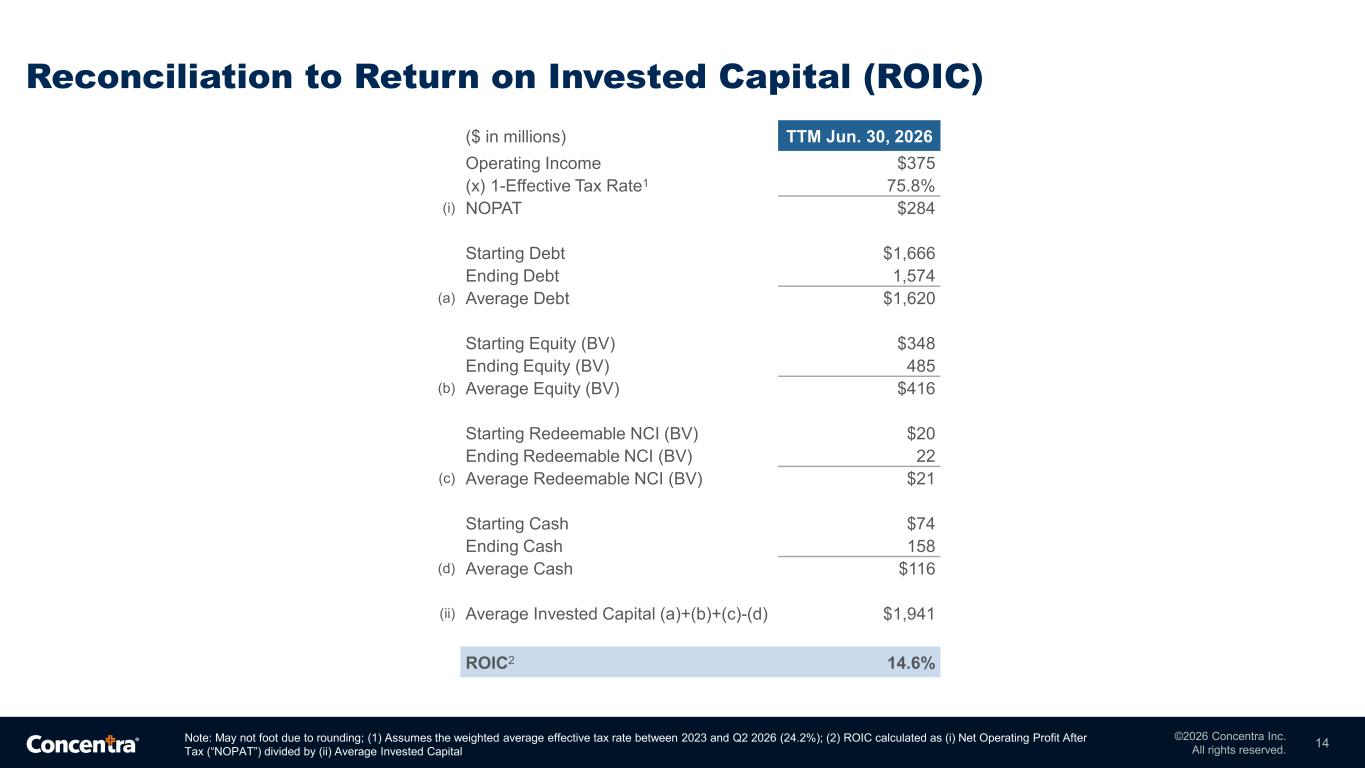
©2026 Concentra Inc. All rights reserved. Reconciliation to Return on Invested Capital (ROIC) 14Note: May not foot due to rounding; (1) Assumes the weighted average effective tax rate between 2023 and Q2 2026 (24.2%); (2) ROIC calculated as (i) Net Operating Profit After Tax (“NOPAT”) divided by (ii) Average Invested Capital ($ in millions) TTM Jun. 30, 2026 Operating Income $375 (x) 1-Effective Tax Rate1 75.8% (i) NOPAT $284 Starting Debt $1,666 Ending Debt 1,574 (a) Average Debt $1,620 Starting Equity (BV) $348 Ending Equity (BV) 485 (b) Average Equity (BV) $416 Starting Redeemable NCI (BV) $20 Ending Redeemable NCI (BV) 22 (c) Average Redeemable NCI (BV) $21 Starting Cash $74 Ending Cash 158 (d) Average Cash $116 (ii) Average Invested Capital (a)+(b)+(c)-(d) $1,941 ROIC2 14.6%